1 Mini Project 1
In this first mini project, you will be introduced to some common and state-of-the-art tools in the field of GIS and semantic 3D city modelling. These tools are used not only for storing and exchanging but also for visualizing semantic 3D city models.
The tasks required in this mini project are not “fictitious”, they are in fact already performed on a regular basis in GIS and 3D city modelling by many institutes, organizations and users. It is therefore of advantage that, by the end of this mini project, you familiarize yourselves with the tools and understand what they do and how they operate together.
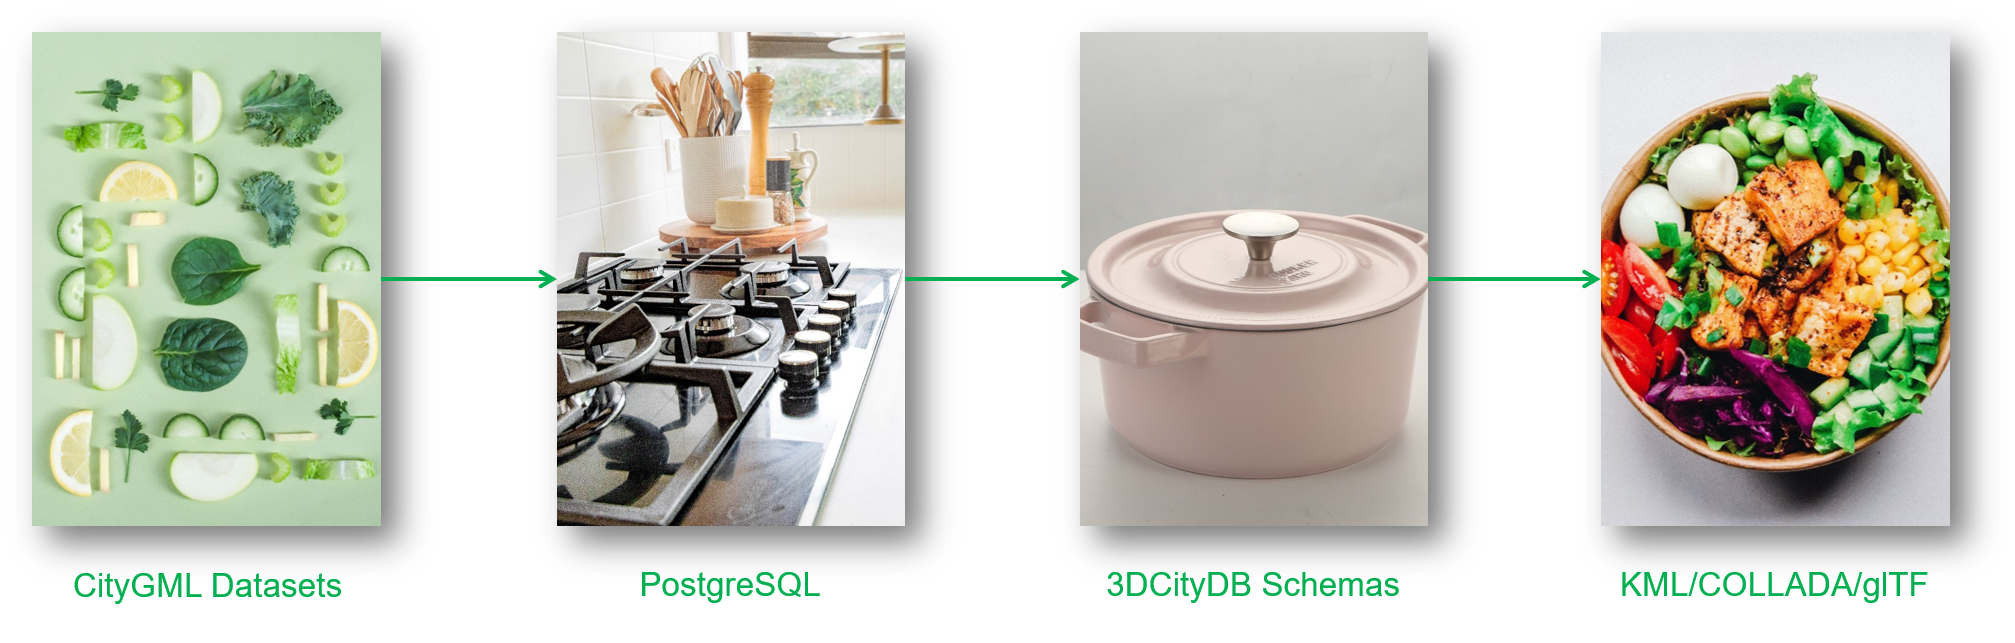
The main objective of this mini project is to visualize 3D city models based on the datasets given in CityGML. Most of the tools required are open-source and can be executed using their Docker containers. The workflow is therefore divided into the following steps:
1.1 Prepare input CityGML datasets and Install Docker
1.2 Set up PostgreSQL + 3DCityDB and Import CityGML datasets
1.3 Export KML/COLLADA/glTF files and Visualize
This chain of process can be thought of as the art of cooking, where the CityGML input datasets would be the ingredients, the stove would be the PostgreSQL database, the cooker would be the 3DCityDB schemas on top and the beautiful delicious dish at the end would represent the visualization of KML/COLLADA/glTF exported from the 3DCityDB. An overview of this workflow is illustrated as follows:
1.1 Prepare input CityGML datasets and Install Docker
1.1.1 Download CityGML datasets
In this mini project, you will be using the CityGML datasets provided for free by the German State of North Rhein-Westphalia (NRW). They are open-source and available to the public, whereas further open datasets are listed here, including Bavaria.
Go to the geoportal of NRW
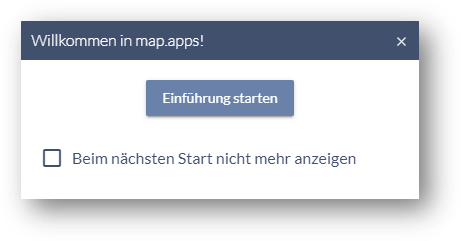
Upon the first visit, you can follow the tutorial to familiarize yourself with the web client by clicking Einführung starten:
Note
Select the option Beim nächsten Start nicht mehr anzeigen to disable this popup the next time you open the app.
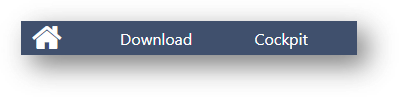
To open the download window, simply click the button Download in the top left corner:
The first time the app is launched, there might be a greeting popup on the side of the screen. Close it by clicking the button Schließen:
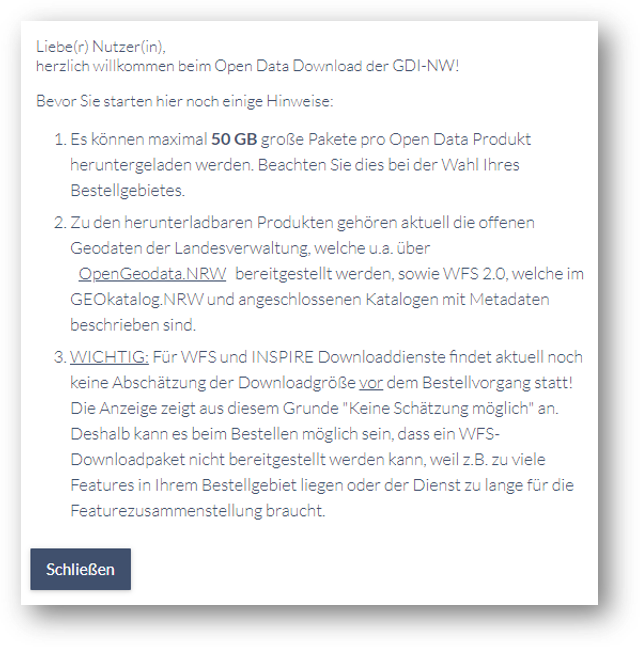
A download popup window shall now appear as follows:
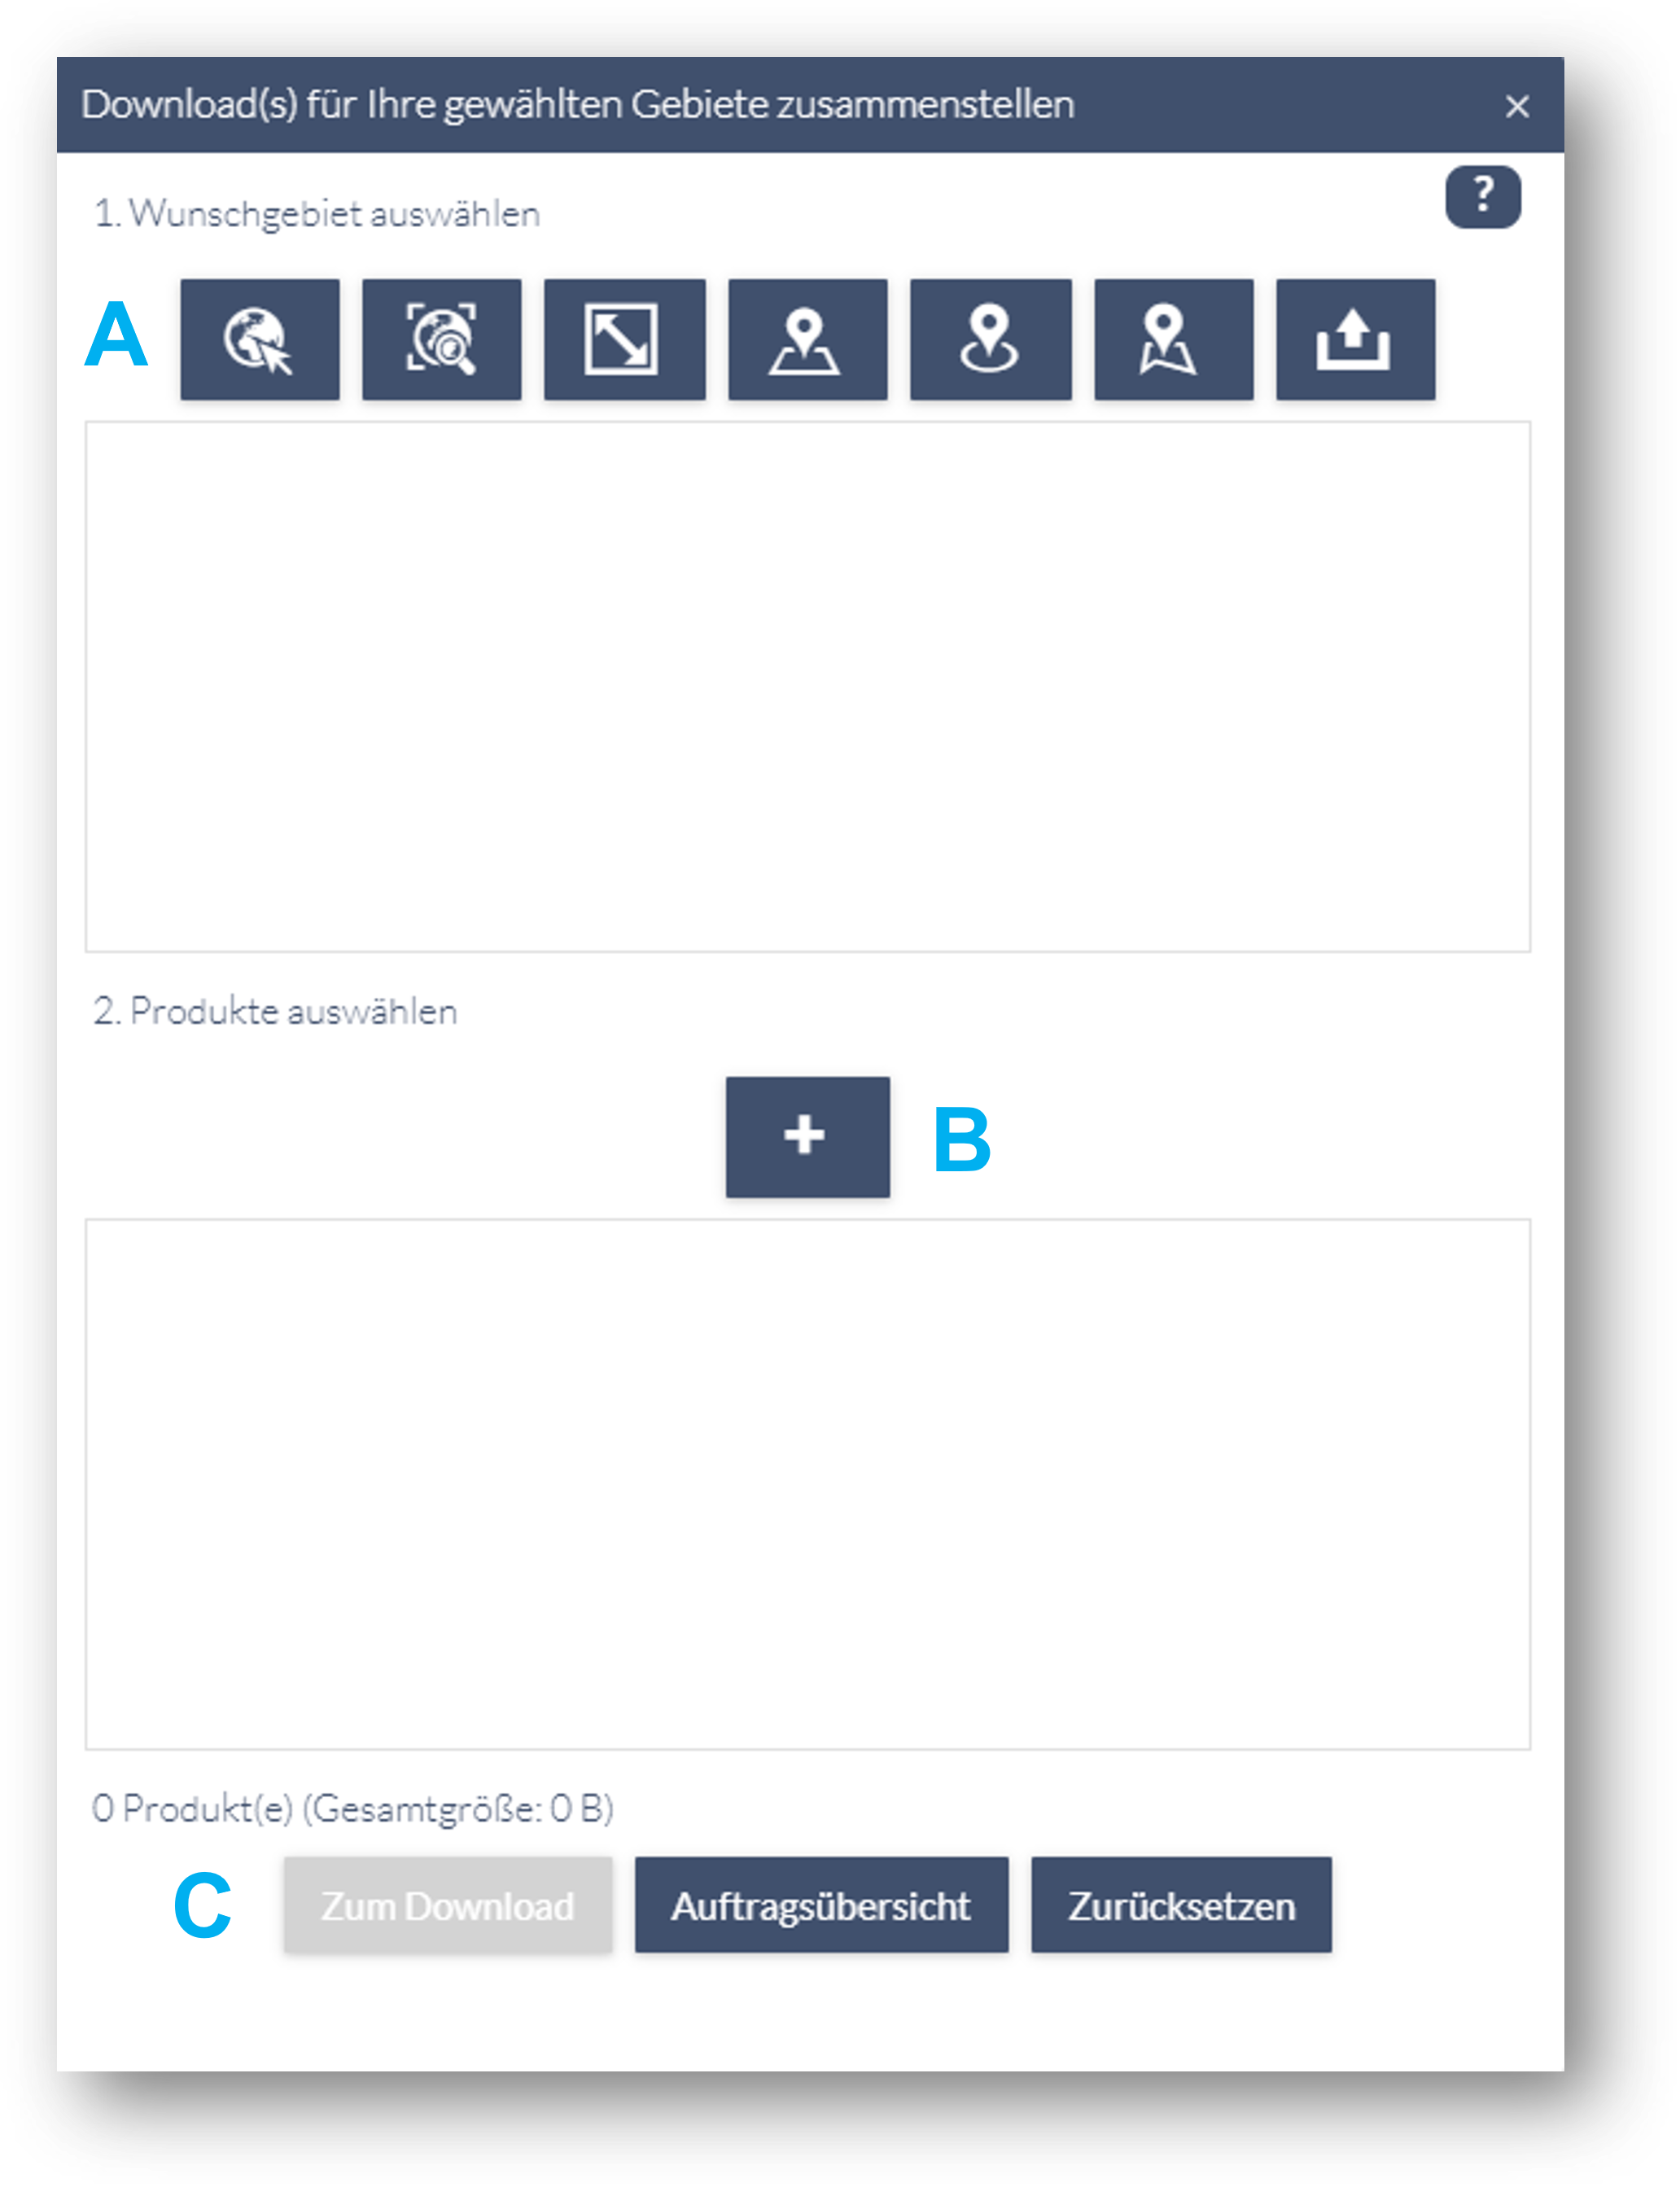
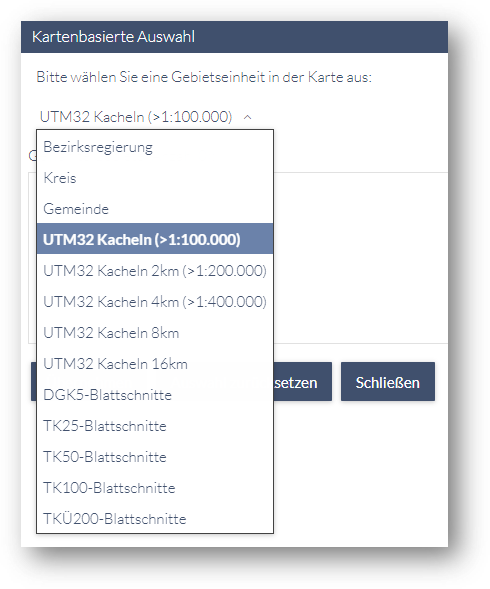
In order to select a region to export, click on the left-most button in the row A in the download popup window shown in the previous step. Then select UTM32 Kacheln (>1:100.000) from the dropdown list:
This will display a grid of tiles on the map:
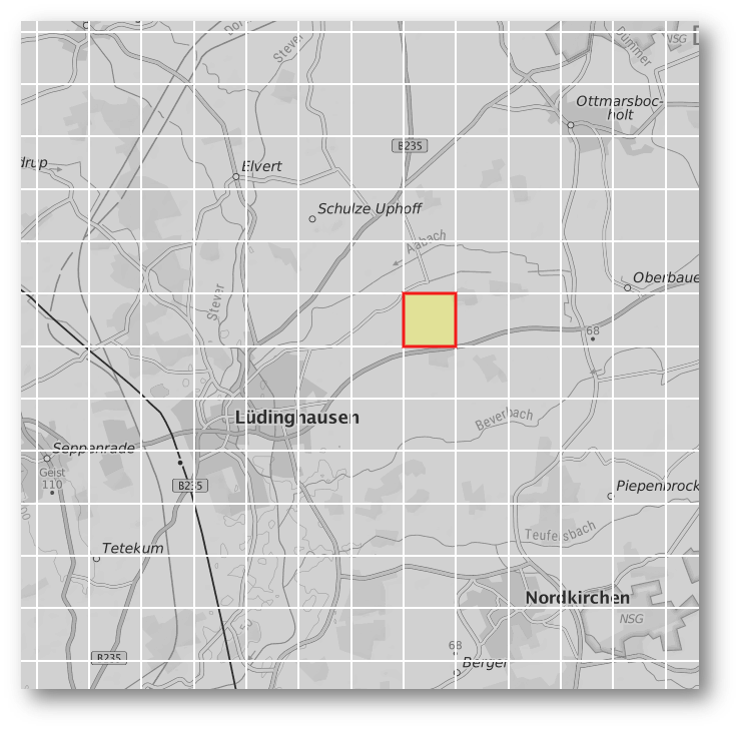
Simply select a tile that you would like to export and then click Übernehmen to confirm your selection:
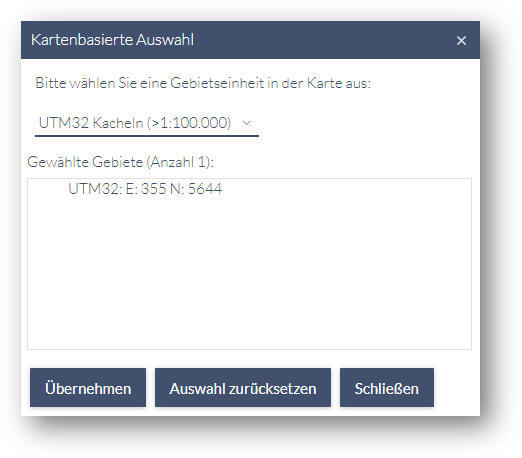
The selected tile shall now be shown. If necessary, this can be removed by clicking on the red X button in front of the tile’s name.
Note
Please choose a tile randomly on the map so that no two groups produce the same results.
Click on the button B shown in the download popup window in step 5 to select which types of data to export. A new popup window shall appear. Type CityGML in the text field Daten durchsuchen to search for available CityGML datasets of the selected tile. Two results should appear for LoD1 and LoD2 CityGML datasets:
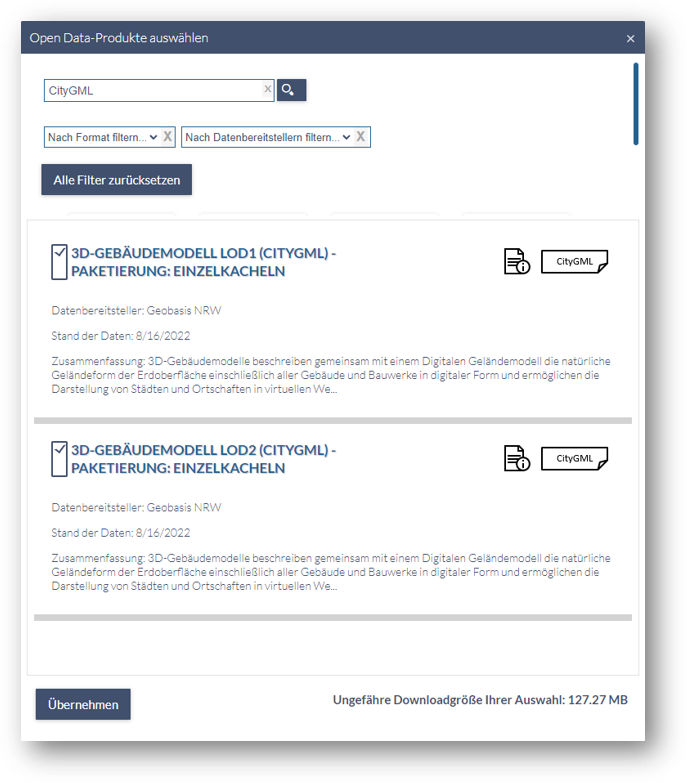
Select both options and confirm by clicking Übernehmen.
An overview of the datasets you have selected is shown as follows:
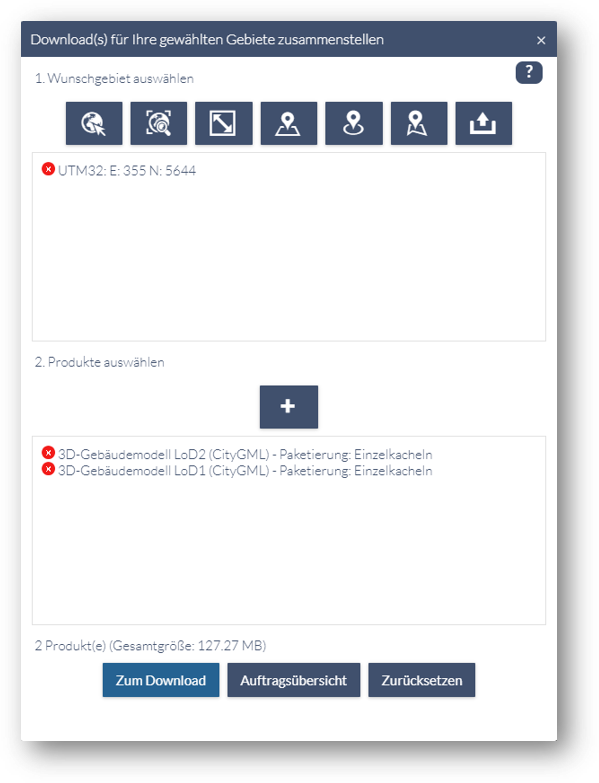
Finally, click on the button C shown in step 5 (Zum Download) to download the datasets. Wait a few seconds for the CityGML datasets of the selected tile to finish loading and then click on each dataset to download.
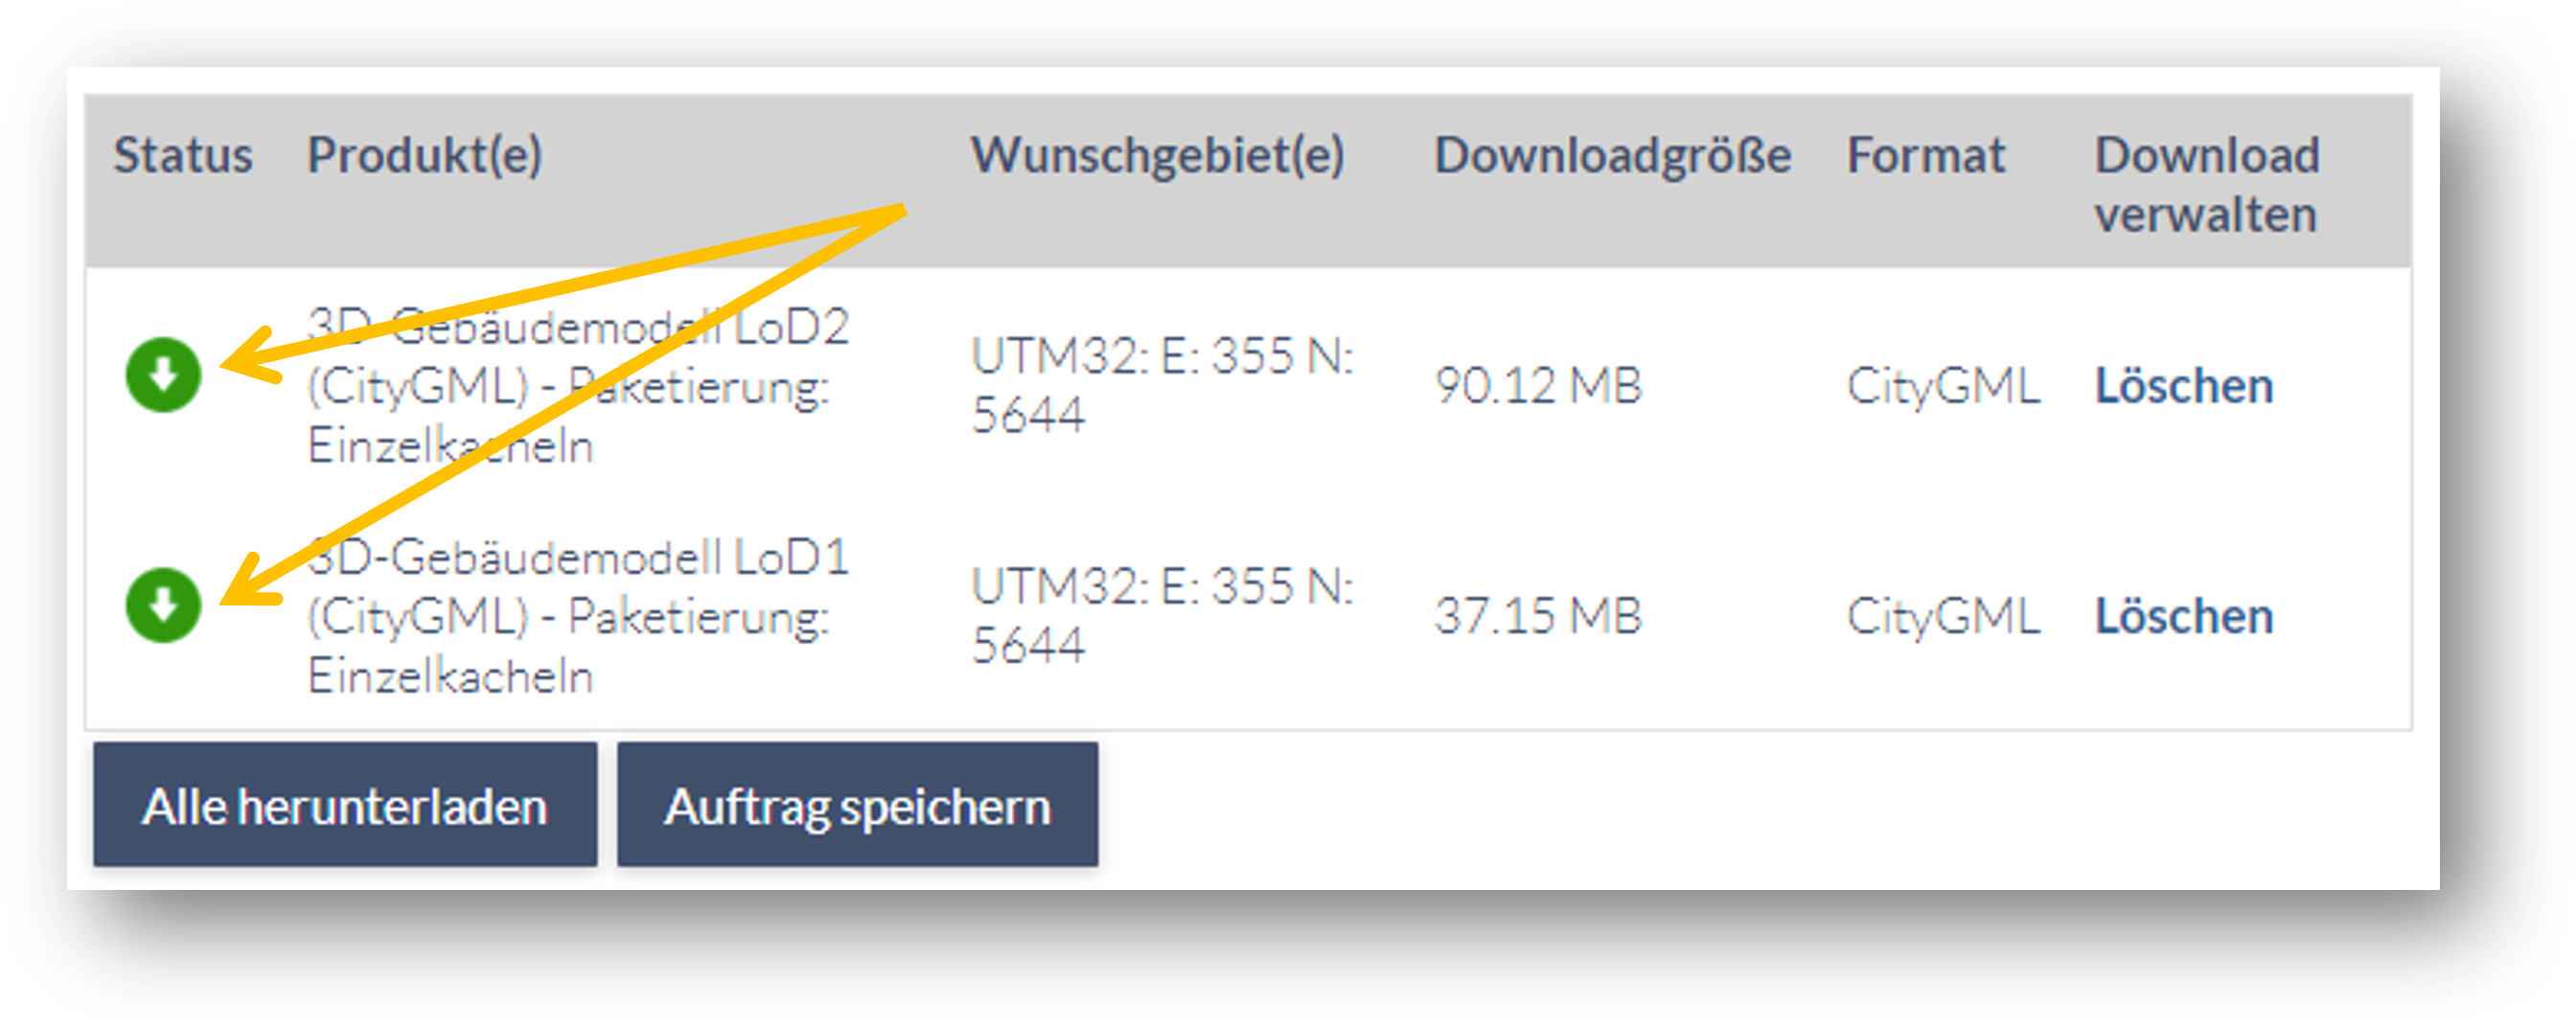
Warning
Do NOT click on Alle herunterladen, since this appears to only download one CityGML dataset. Instead click on each dataset to download them individually.
Unzip the downloaded files into two directories
LoD1andLoD2inside a directory with path<host_data_dir>. The directory structure should look like as follows:<host_data_dir> |--------- LoD1 | |----- <lod1_citygml_file> |--------- LoD2 | |----- <lod2_citygml_file>
1.1.2 Install Docker
Most of the tools employed in this mini project are also available as Docker containers. Docker is an open platform for developing, shipping, and running applications. Docker enables you to separate your applications from your infrastructure so you can deliver software quickly. This means that in order to run all the tools mentioned above, you’d only need to install Docker instead of multiple programs at once. Moreover, since the Docker containers are separated from each other and from the host’s system, you can eventually remove the containers easily without leaving any/much trace in your system.
To install Docker Desktop, please refer to this page.
Tip
Since you will be working intensively with Command Line Interface (CLI), if you are using Windows, it is recommended to install another CLI tool in addition to the existing (but very limited) CMD tool in Windows. One example is cmder, which allows organizing console windows in tabs similarly to those in the web browsers. You can also use native Unix commands such as ls, mkdir, git etc.
Tip
In Unix, by default, Docker requires a root user for running, i.e. you would need to add sudo before every docker command. If you do not want to use root everytime, follow the following steps (source):
# In Unix

# Create the docker group
sudo groupadd docker

# Add current user to the docker group
sudo usermod -aG docker $USER

# Log out and back in again to apply the changes, or run the following command
newgrp docker
1.2 Set up PostgreSQL + 3DCityDB and Import CityGML datasets
1.2.1 Create a network for Docker containers
The Docker containers created in this mini project need to communicate with each other. This requires a Docker network.
Docker command
docker network create <name_dockernet>
-
<name_dockernet>¶ The name of the Docker network the containers will be using for communication.
Example
docker network create citydb-net
The created network should then be listed using the following command:
docker network ls
1.2.2 Set up 3DCityDB on top of PostgreSQL
The 3DCityDB schemas shall now be installed on top of the existing PostgreSQL database.
Docker command
# Unix
docker run --name <name_3dcitydb_container> -d \
    --network <name_dockernet> \
    -e POSTGRES_PASSWORD=<password_postgresql> \
    -e SRID=<srid> \
    -e GMLSRSNAME=<gmlsrsname> \
    -e POSTGRES_DB=<name_3dcitydb> \
    -e POSTGRES_USER=postgres \
  3dcitydb/3dcitydb-pg
# Windows
docker run --name <name_3dcitydb_container> -d ^
    --network <name_dockernet> ^
    -e POSTGRES_PASSWORD=<password_postgresql> ^
    -e SRID=<srid> ^
    -e GMLSRSNAME=<gmlsrsname> ^
    -e POSTGRES_DB=<name_3dcitydb> ^
    -e POSTGRES_USER=postgres ^
  3dcitydb/3dcitydb-pg
Description
-
<name_3dcitydb_container>¶ The name of the Docker container for the 3DCityDB.
-
<name_dockernet>¶ The name of the Docker network the containers will be using for communication. This must be the same as defined in the previous steps.
-
-ePOSTGRES_PASSWORD=<password_postgresql>¶ The password for accessing the PostgreSQL database. Please change this to a secure value.
-
-eSRID=<srid>¶ The EPSG code for the 3DCityDB instance. This can be found by inspecting the contents of the CityGML datasets. For this mini project, the value
25832can be used. For more information on this EPSG code, please refer to this page.
-
-eGMLSRSNAME=<gmlsrsname>¶ The GML SRS name for the 3DCityDB instance. This can be found by inspecting the contents of the CityGML datasets. For this mini project, the value
urn:adv:crs:ETRS89_UTM32*DE_DHHN2016_NHcan be used.
-
-ePOSTGRES_DB=<name_3dcitydb>¶ The name for the database containing the 3DCityDB schemas.
For more information on the Docker command, please refer to this page.
Example
# Unix
docker run --name my_3dcitydb_container -d \
    --network citydb-net \
    -e POSTGRES_PASSWORD=my_secret \
    -e SRID=25832 \
    -e GMLSRSNAME="urn:adv:crs:ETRS89_UTM32*DE_DHHN2016_NH" \
    -e POSTGRES_DB=my_pgdb \
    -e POSTGRES_USER=postgres \
  3dcitydb/3dcitydb-pg
# Windows
docker run -it --name my_3dcitydb_container -d ^
    --network citydb-net ^
    -e POSTGRES_PASSWORD=my_secret ^
    -e SRID=25832 ^
    -e GMLSRSNAME="urn:adv:crs:ETRS89_UTM32*DE_DHHN2016_NH" ^
    -e POSTGRES_DB=my_pgdb ^
    -e POSTGRES_USER=postgres ^
  3dcitydb/3dcitydb-pg
Note
Please wait for a few seconds before executing the next command while the container is being set up in the background. Alternatively, execute the following command:
# Change "my_3dcitydb_container" to your container's name
docker logs --follow --tail 10 my_3dcitydb_container
This will show the last 10 lines of the logs being written by the container. Wait until you see the line:
[1] LOG: database system is ready to accept connections
This means that the container has been successfully set up. Press Ctrl + C to exit viewing the logs.
1.2.3 Check if the container is running
Docker command
docker ps -a
A container with the given name <name_3dcitydb_container> (e.g. my_3dcitydb_container) should appear with its ID <id_3dcitydb>`:
CONTAINER ID |
IMAGE |
COMMAND |
CREATED |
STATUS |
PORTS |
NAMES |
|---|---|---|---|---|---|---|
1ccb72152cac |
3dcitydb/3dcitydb-pg |
“docker-entrypoint.s…” |
Less than a second ago |
Up 3 seconds |
5432/tcp |
my_3dcitydb_container |
Warning
If you need to delete the container (such as to create a new one), use the following command:
docker rm -f <id_3dcitydb>
1.2.4 Import CityGML Datesets into the 3DCityDB
Once the 3DCityDB schemas have been set up, the next step is to import CityGML datasets into the database. This can be achieved using the 3DCityDB Importer/Exporter.
Docker command
# Unix
docker run --rm --name <name_impexp_container> \
    --network <name_dockernet> \
    -v <input_data_dir>:/data \
  3dcitydb/impexp import \
    --db-host=<name_3dcitydb_container> \
    --db-name=<name_3dcitydb> \
    --db-port=5432 \
    -u postgres \
    --db-password=<password_postgresql> \
  <citygml_file>
# Windows
docker run --rm --name <name_impexp_container> ^
    --network <name_dockernet> ^
    -v <host_data_dir>:/data ^
  3dcitydb/impexp import ^
    --db-host=<name_3dcitydb_container> ^
    --db-name=<name_3dcitydb> ^
    --db-port=5432 ^
    -u postgres ^
    --db-password=<password_postgresql> ^
  <citygml_file>
Description
-
--name<name_impexp_container>¶ The name of the Docker container for the 3DCityDB Importer/Exporter.
-
--network<name_dockernet>¶ The name of the Docker network the containers will be using for communication. This must be the same as defined in the previous steps.
-
-v<input_data_dir>:/data¶ The path to the directory of the host system where the CityGML files are stored. This allows sharing data between the host and the container. In this mini project,
<input_data_dir>points to the two sub-directoriesLoD1andLoD2of<host_data_dir>defined in the previous steps. This means that this Docker command must be called twice to import two CityGML datasets into the database.Note
<input_data_dir>must be an absolute path to the directory containing the CityGML files. For instance,/my/data/LoD1in Unix or"C:\data\LoD1"in Windows (notice the quotation marks).
-
--db-password=<password_postgresql>¶ The password for accessing the PostgreSQL database. This must be the same as defined in the previous steps.
-
<citygml_file>¶ The name of the CityGML file.
Note
The file
<citygml_file>must be stored in the directory<input_data_dir>, otherwise the Importer/Exporter will not find a valid CityGML file to import to the database.
For more information on the Docker command, please refer to this page.
Example
# Unix - Import LoD1 CityGML file
docker run --rm --name my_impexp \
    --network citydb-net \
    -v /my/data/LoD1:/data \
  3dcitydb/impexp import \
    --db-host=my_3dcitydb_container \
    --db-name=my_pgdb \
    --db-port=5432 \
    -u postgres \
    --db-password=my_secret \
  LoD1_32_409_5701_1_NW.gml
# Unix - Import LoD2 CityGML file
docker run --rm --name my_impexp \
    --network citydb-net \
    -v /my/data/LoD2:/data \
  3dcitydb/impexp import \
    --db-host=my_3dcitydb_container \
    --db-name=my_pgdb \
    --db-port=5432 \
    -u postgres \
    --db-password=my_secret \
  LoD2_32_409_5701_1_NW.gml
# Windows - Import LoD1 CityGML file
docker run --rm --name my_impexp ^
    --network citydb-net ^
    -v "C:\data\LoD1":/data ^
  3dcitydb/impexp import ^
    --db-host=my_3dcitydb_container ^
    --db-name=my_pgdb ^
    --db-port=5432 ^
    -u postgres ^
    --db-password=my_secret ^
  LoD1_32_409_5701_1_NW.gml
# Windows - Import LoD2 CityGML file
docker run --rm --name my_impexp ^
    --network citydb-net ^
    -v "C:\data\LoD2":/data ^
  3dcitydb/impexp import ^
    --db-host=my_3dcitydb_container ^
    --db-name=my_pgdb ^
    --db-port=5432 ^
    -u postgres ^
    --db-password=my_secret ^
  LoD2_32_409_5701_1_NW.gml
1.3 Export KML/COLLADA/glTF files and Visualize
1.3.1 Export KML/COLLADA/glTF files
Now that the 3DCityDB has been set up and all input CityGML datasets have been imported into the database, the final step is to export visualization files (KML/COLLADA/glTF) from the database.
Docker command
# Unix
docker run -it --rm --name <name_impexp_container> \
  --network <name_dockernet> \
  -v <input_data_dir>:/data \
  3dcitydb/impexp export-vis \
    --db-host=<name_3dcitydb_container> \
    --db-name=<name_3dcitydb> \
    --db-port=5432 \
    -u postgres \
    --db-password=<password_postgresql> \
    --lod=<lodx> \
    --display-form=collada \
    --gltf \
    --gltf-binary \
    --gltf-embed-textures \
    --gltf-draco-compression \
    -O globe \
  -o /data/export.kml
# Windows
docker run -it --rm --name <name_impexp_container> ^
  --network <name_dockernet> ^
  -v <input_data_dir>:/data ^
  3dcitydb/impexp export-vis ^
    --db-host=<name_3dcitydb_container> ^
    --db-name=<name_3dcitydb> ^
    --db-port=5432 ^
    -u postgres ^
    --db-password=<password_postgresql> ^
    --lod=<lodx> ^
    --display-form=collada ^
    --gltf ^
    --gltf-binary ^
    --gltf-embed-textures ^
    --gltf-draco-compression ^
    -O globe ^
  -o /data/export.kml
Description
-
--name<name_impexp_container>¶ The name of the Docker container for the 3DCityDB Importer/Exporter.
-
--network<name_dockernet>¶ The name of the Docker network the containers will be using for communication. This must be the same as defined in the previous steps.
-
-v<input_data_dir>:/data¶ The path to the directory of the host system where the CityGML files are stored. This allows sharing data between the host and the container. In this mini project,
<input_data_dir>points to the two sub-directoriesLoD1andLoD2of<host_data_dir>defined in the previous steps. This means that this Docker command must be called twice to export LoD1 and LoD2 files from the database.Note
<input_data_dir>must be an absolute path to the directory containing the exported visualization files. For instance,/my/data/LoD1in Unix or"C:\data\LoD1"in Windows (notice the quotation marks).
-
--db-host=<name_3dcitydb_container>¶ The name of the Docker container for the 3DCityDB. This must be the same as defined in the previous steps.
-
--db-name=<name_3dcitydb>¶ The name for the database containing the 3DCityDB schemas. This must be the same as defined in the previous steps.
-
--db-password=<password_postgresql>¶ The password for accessing the PostgreSQL database. This must be the same as defined in the previous steps.
-
--lod=<lodx>¶ The level of detail (LoD0-4) to be exported. Depending on the
<input_data_dir>and its CityGML file, the value1for LoD1 and2for LoD2 shall be used. This means that this Docker command must be called twice to export LoD1 and Lod2 visualization files from the database.
For more information on the Docker command, please refer to this page.
Example
# Unix - Export LoD1 visualization files
docker run -it --rm --name my_impexp \
  --network citydb-net \
  -v /my/data/LoD1:/data \
  3dcitydb/impexp export-vis \
    --db-host=my_3dcitydb_container \
    --db-name=my_pgdb \
    --db-port=5432 \
    -u postgres \
    --db-password=my_secret \
    --lod=1 \
    --display-form=collada \
    --gltf \
    --gltf-binary \
    --gltf-embed-textures \
    --gltf-draco-compression \
    -O globe \
  -o /data/export.kml
# Unix - Export LoD2 visualization files
docker run -it --rm --name my_impexp \
  --network citydb-net \
  -v /my/data/LoD2:/data \
  3dcitydb/impexp export-vis \
    --db-host=my_3dcitydb_container \
    --db-name=my_pgdb \
    --db-port=5432 \
    -u postgres \
    --db-password=my_secret \
    --lod=2 \
    --display-form=collada \
    --gltf \
    --gltf-binary \
    --gltf-embed-textures \
    --gltf-draco-compression \
    -O globe \
  -o /data/export.kml
# Windows - Export LoD1 visualization files
docker run -it --rm --name my_impexp ^
  --network citydb-net ^
  -v "C:\data\LoD1":/data ^
  3dcitydb/impexp export-vis ^
    --db-host=my_3dcitydb_container ^
    --db-name=my_pgdb ^
    --db-port=5432 ^
    -u postgres ^
    --db-password=my_secret ^
    --lod=1 ^
    --display-form=collada ^
    --gltf ^
    --gltf-binary ^
    --gltf-embed-textures ^
    --gltf-draco-compression ^
    -O globe ^
  -o /data/export.kml
# Windows - Export LoD2 visualization files
docker run -it --rm --name my_impexp ^
  --network citydb-net ^
  -v "C:\data\LoD2":/data ^
  3dcitydb/impexp export-vis ^
    --db-host=my_3dcitydb_container ^
    --db-name=my_pgdb ^
    --db-port=5432 ^
    -u postgres ^
    --db-password=my_secret ^
    --lod=2 ^
    --display-form=collada ^
    --gltf ^
    --gltf-binary ^
    --gltf-embed-textures ^
    --gltf-draco-compression ^
    -O globe ^
  -o /data/export.kml
1.3.2 Visualization
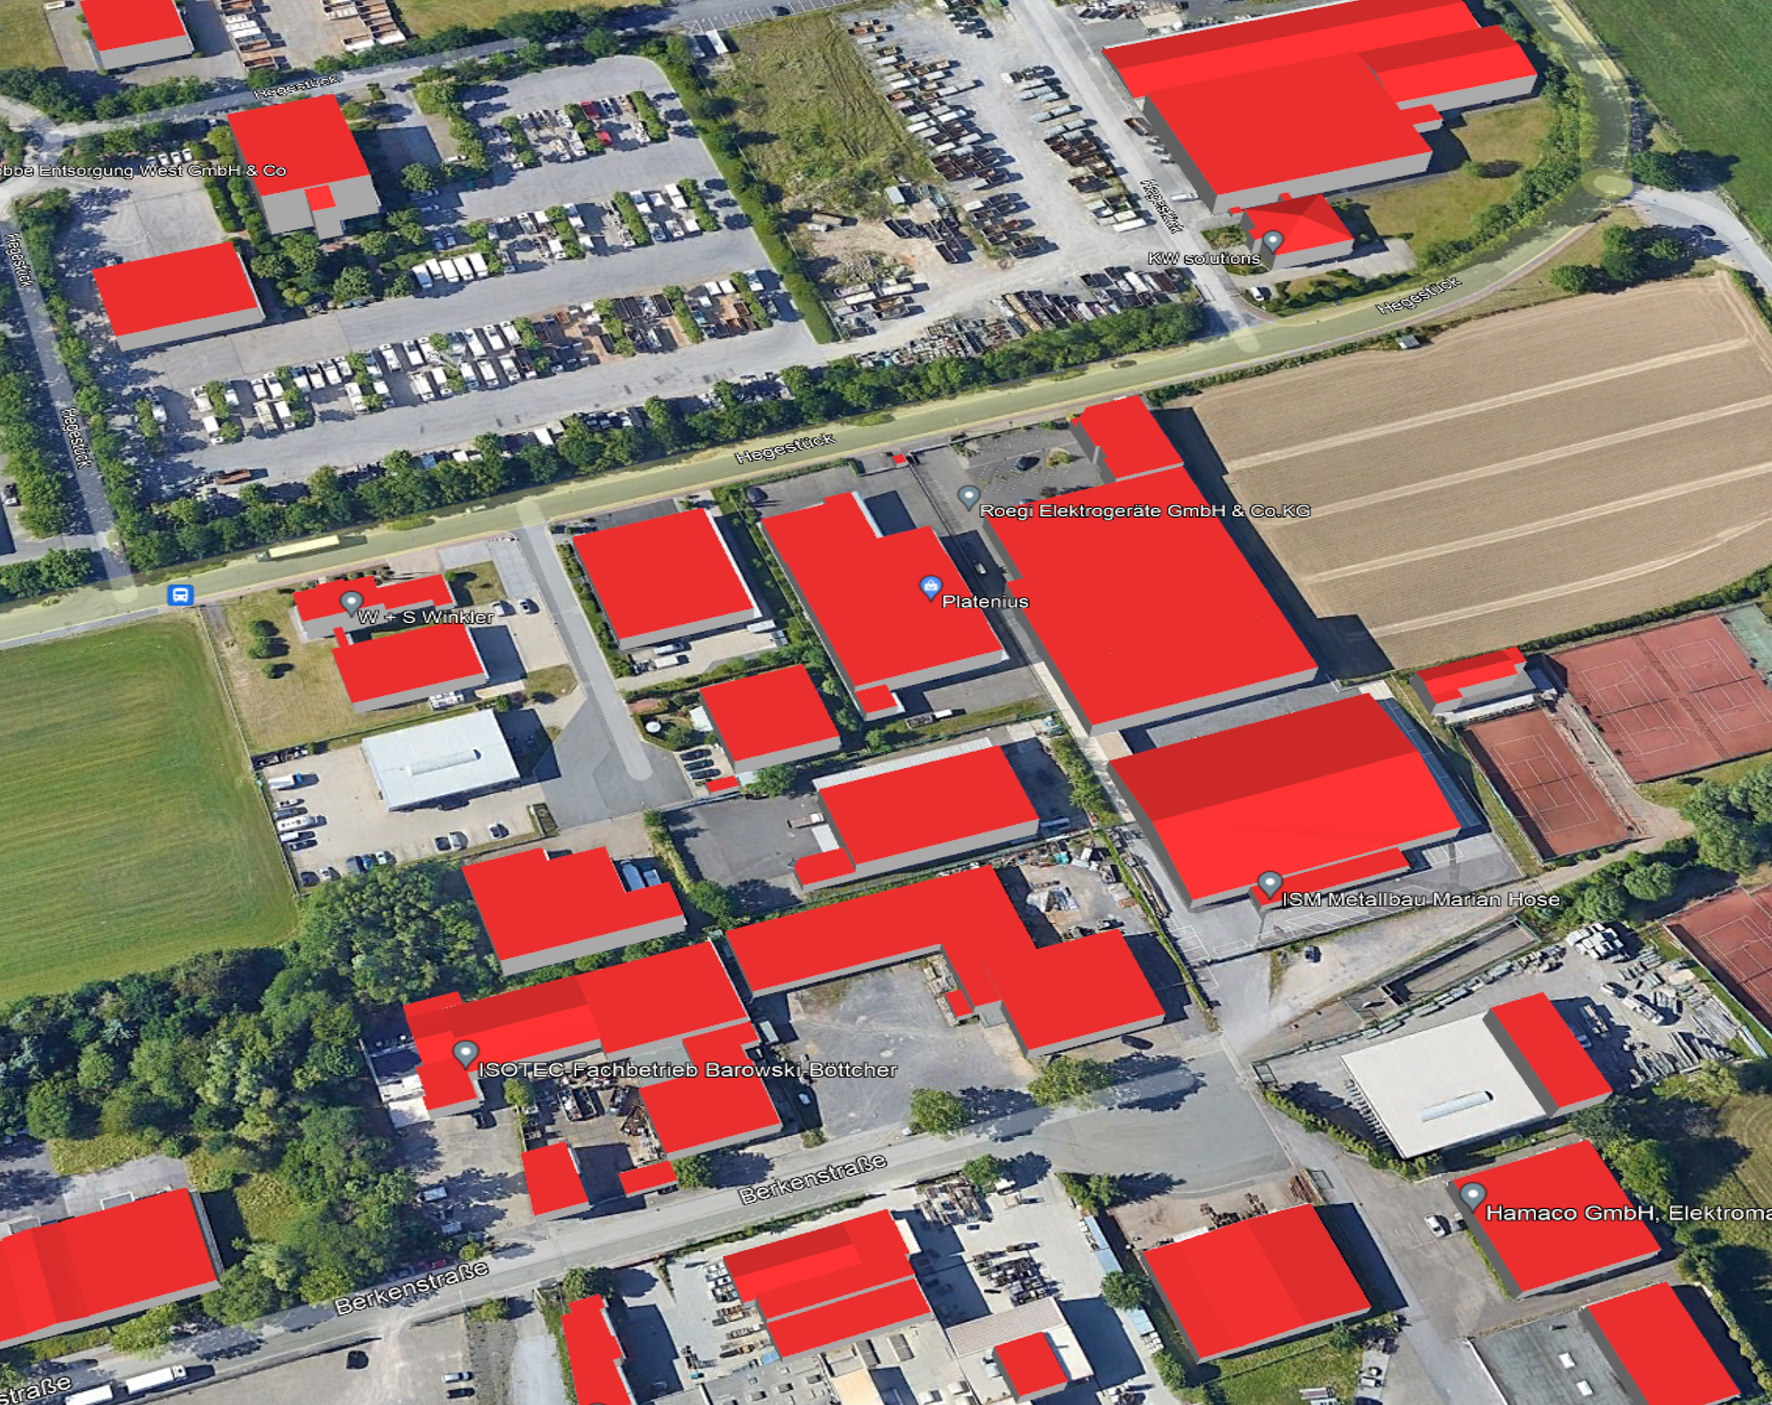
The exported visualization files should now be stored in both directories <host_data_dir>/LoD1 and <host_data_dir>/LoD2. Depending on the data exchange formats, they can be visualized using different software. For example, COLLADA files can be visualized using Google Earth and KML/glTF files can be visualized using the 3DCityDB Web Map Client.
1.3.2.1 Visualizing COLLADA in Google Earth
If you not installed Google Earth Pro on your machine, head to this page and install it.
Once the installation is complete, drag and drop the KML file export.kml in <host_data_dir>/LoD1 and <host_data_dir>/LoD2 onto Google Earth. The results should look like this:
Note
Although COLLADA files are to be visualized in this section, a KML file is used as a manifest / metadata covering all COLLADA files that are divided into multiple tiles. You can inspect the tiles by changing to the sub-directories of <host_data_dir>/LoDX/Tiles/....
Note
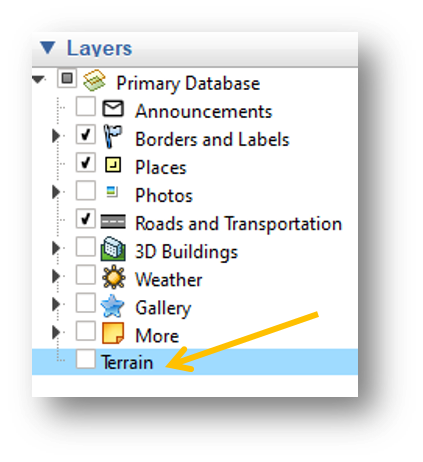
The building models are visualized withthout altitude (h = 0). If you cannot see the models in Google Earth, it may be due to the terrain covering the models. Uncheck the option Terrain in the Layers section to disable terrain:
Tip
You can import both the LoD1 and LoD2 files in Google Earth and turn one on/off to see the difference between the models.
1.3.2.2 Visualizing glTF in 3DCityDB Web Map Client
Docker command
# Unix
docker run -it --name <name_webclient_container> -p <port_webclient>:8000 -d \
    -v <host_data_dir>:/var/www/data \
  tumgis/3dcitydb-web-map
# Windows
docker run -it --name <name_webclient_container> -p <port_webclient>:8000 -d ^
    -v <host_data_dir>:/var/www/data ^
  tumgis/3dcitydb-web-map
Description
-
--name<name_webclient_container>¶ The name of the Docker container for the 3DCityDB Web Map Client.
-
-p<port_webclient>:8000¶ The port number the host is using to expose the 3DCityDB Web Map Client.
-
-v<host_data_dir>:/var/www/data¶ The path to the directory of the host system where all the visualization files (both LoD1 and LoD2) are stored. This allows sharing data between the host and the container. In this mini project,
<host_data_dir>is the directory containing the two sub-directoriesLoD1andLoD2defined in the previous steps. This means that this Docker command does NOT have to be called twice to visualize the LoD1 and LoD2 files.Note
<host_data_dir>must be an absolute path to the directory containing the visualization files. For instance,/my/datain Unix or"C:\data"in Windows (notice the quotation marks).
For more information on the Docker command, please refer to this page. For more information on the Web Client itself, please refer to this page.
Example
# Unix
docker run -it --name my_webclient -p 8765:8000 -d \
    -v /my/data:/var/www/data \
  tumgis/3dcitydb-web-map
# Windows
docker run -it --name my_webclient -p 8765:8000 -d ^
    -v "C:\data":/var/www/data ^
  tumgis/3dcitydb-web-map
Open the 3DCityDB Web Client
Once the Docker command is complete, open the browser using the following URL:
The web client should look like this:
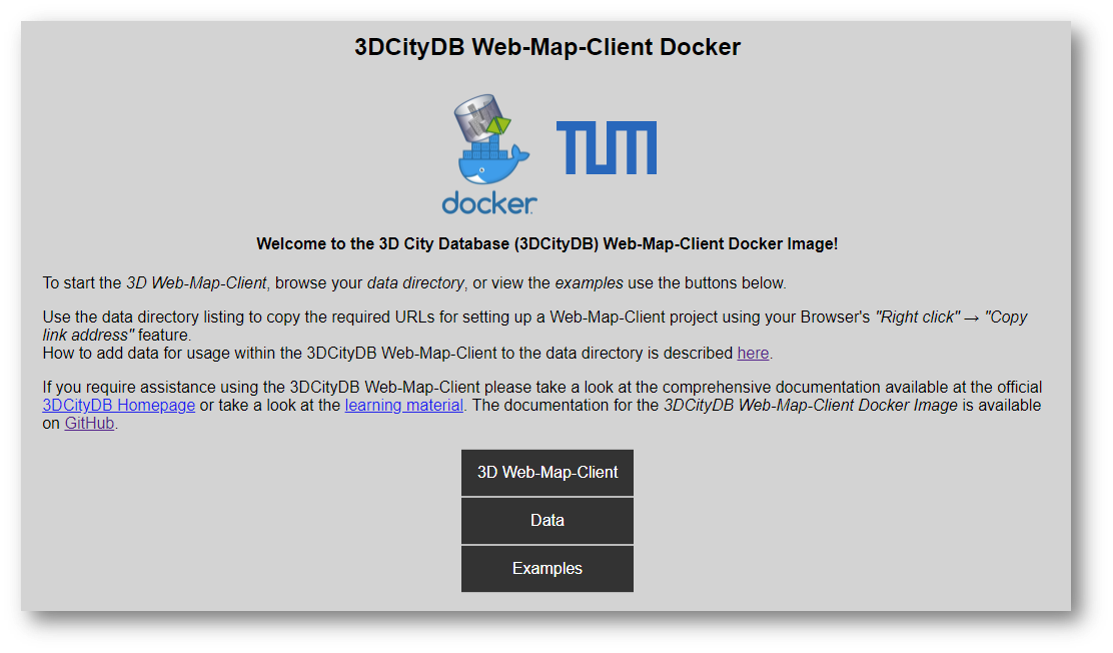
Click on the button Examples to explore what the 3DCityDB Web Map Client is capable of. There are two examples to explore:
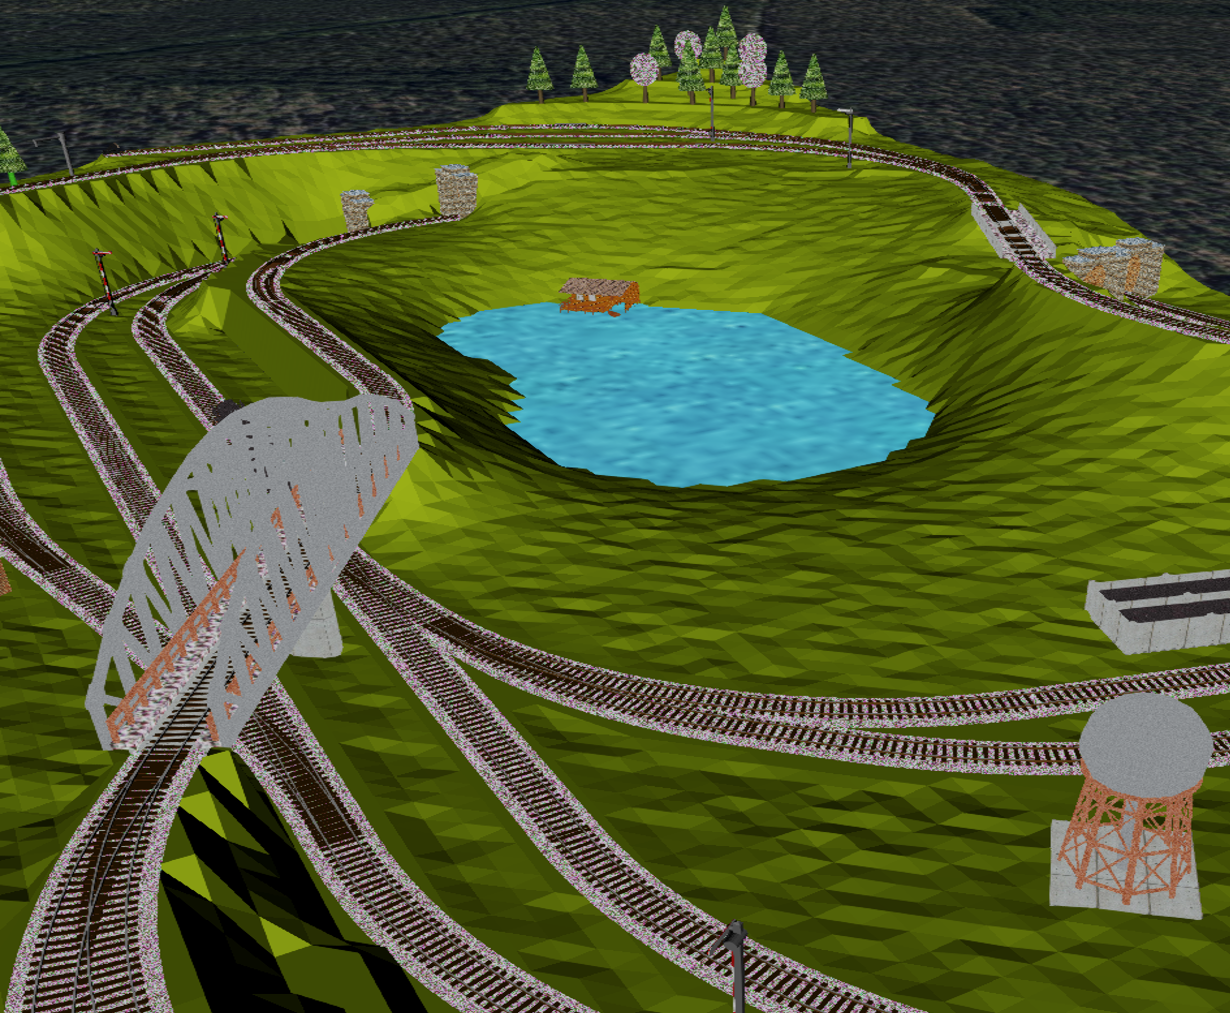
glTFRailwaySceneLoD3Example(glTF model of railways, tunnels, vegetations, etc.) andkmlManhattanExample(3D building models in New York City).In the web client, click on the button add glTF Data Layers to start the visualization. The railways example should look like this:
Go back to the web client page (http://localhost:8765) and click on the button Data. You should see two sub-directories
LoD1andLoD2, each containing the CityGML as well as the visualization files in LoD1 and LoD2 respectively.Go back to the web client page (http://localhost:8765) and click on the button 3D Web-Map-Client to start the 3DCityDB Web Map Client.
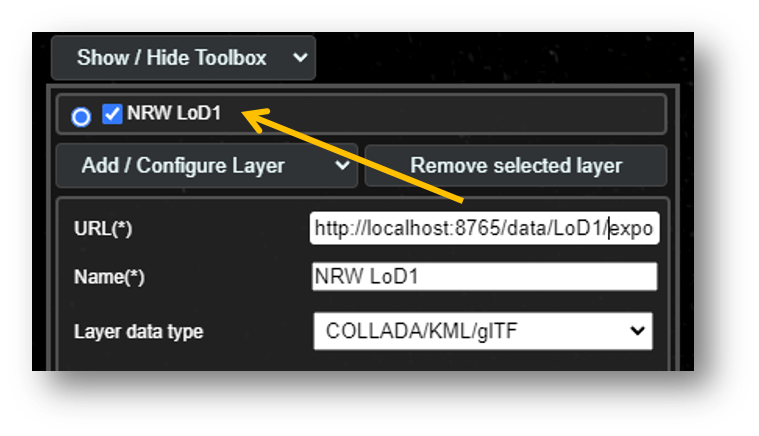
Click on the button Show / Hide Toolbox on the left-hand side of the screen, then Add / Configure Layer to add a new 3D model layer.
In the text field URL(*) insert the following URL: http://localhost:8765/data/LoD1/export_collada_MasterJSON.json
In the text field Name(*) insert
NRW LoD1.Click the button Add layer to add the 3D building models.
Double click on the layer name showned above the button Add / Configure Layer to move the camera to the models:
Repeat the steps 2 to 4 to insert another layer for LoD2.
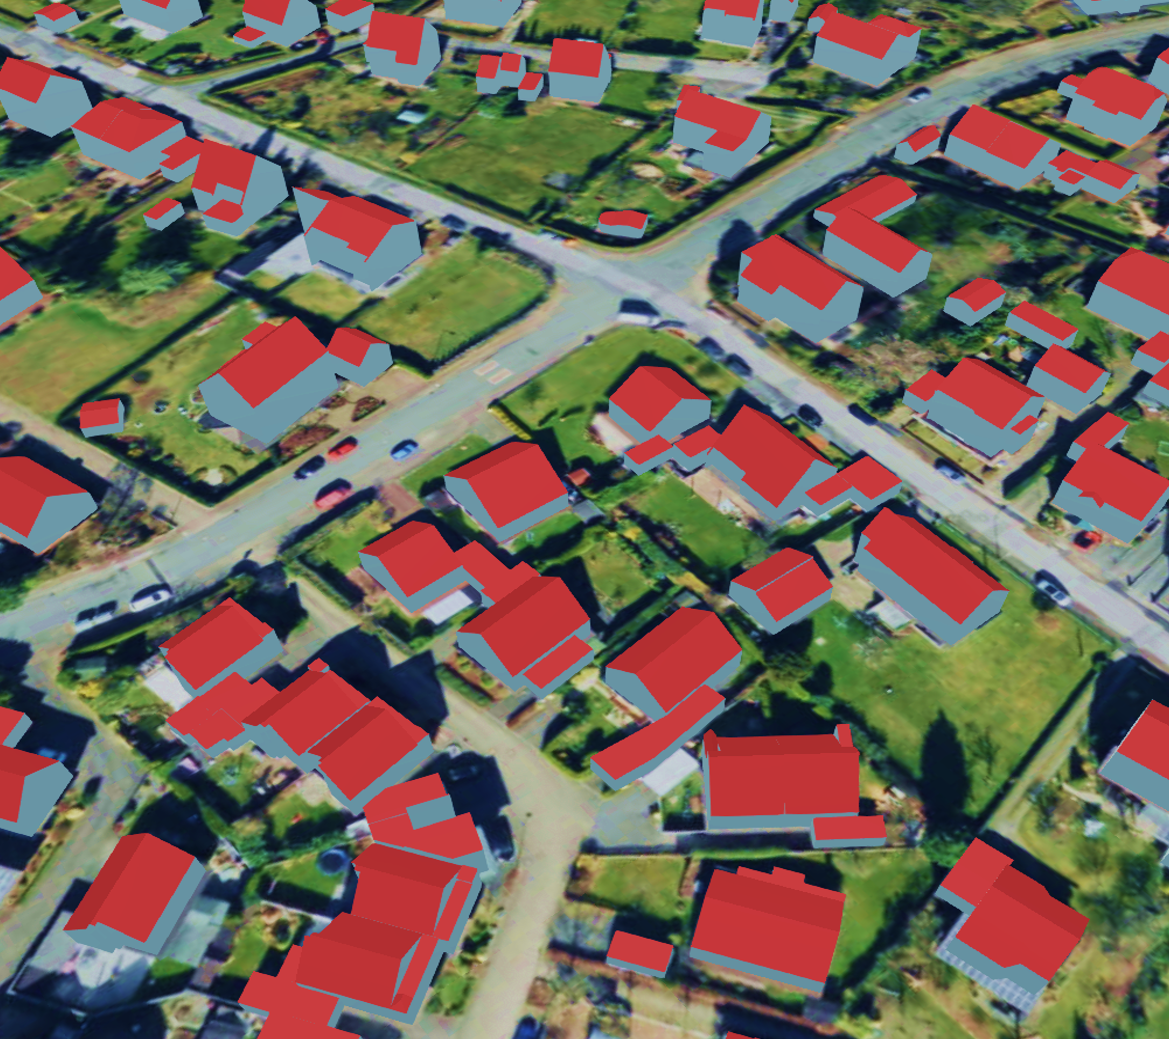
The end results should look like the following:
Tip
Please submit your presentation in PDF and PowerPoint format in Moodle using the following naming scheme:
Mini_Project_1_Group_NN.<pdf|pptx>Please note the submission date on Moodle.
Your presentation slides must be carefully outlined and formatted. Typos, grammatical errors and layout problems will lead to points deduction.
Please include the first names, last names and matriculation numbers of all team members in the first slide of the presentation.
It is sufficient to submit ONCE per group.
1.4 References
North Rhine-Westphalia’s Open Geodata Portal
-
3D City Database
Documentation on using Docker
3DCityDB Importer/Exporter
3DCityDB Web-Map-Client