2 Mini Project 2
In the first mini project, you were introduced to some popular software components used in the field of semantic 3D city modelling in GIS. In this second mini project, we explore another aspect of GIS, namely how to make use of the already established infrastructure to perform some spatio-semantic analyses of urban data as well as to further enrich visualization with thematic data.
The objectives of this mini project are to:
2.1 Enrich Visualization with Thematic Data
2.2 Formulate Queries to the 3DCityDB using PostgREST
2.3 Solar Potential Analyses using SQL
2.1 Enrich Visualization with Thematic Data
In the first mini project, we learned how to import a CityGML dataset into PostgreSQL using the 3DCityDB schemas, how to export KML/COLLADA/glTF files and how to visualize them using Google Earth and the 3DCityDB Web Map Client. The 3DCityDB Web Map Client is however not only capable of displaying visual information, it can also embed thematic data of city objects as well. These include basic building attributes allowed by CityGML (such as function, height, number of storeys, etc.) and generic attributes (attributes with prefix gen:) that can contain information of arbitrary topics related to the respective city object (such as solar radiation/potential in this case).
Using the same workflow as explained in the first mini project, a KML/COLLADA/glTF dataset for visualization of buildings have been prepared and made available for use. From the same original CityGML dataset, the thematic data were also extracted. The objective is then to enrich the visualization files with such thematic data using the 3DCityDB Web Map Client.
Note
The reason why the visualization and thematic data were exported separately is due to the fact that KML/COLLADA/glTF files are incapable of or have limitations in terms of storing thematic data inside their data structure. Another reason to consider them as two separate (but related) sources of information is that while the geometries rarely/slowly change, thematic information can be frequently updated, swapped or replaced completely. Therefore, the 3DCityDB allows enriching different types of thematic information to the same city objects (e.g. buildings, etc.) without changing their graphical appearances.
Instead of using the 3DCityDB Web Map Client hosted locally using Docker, the web client can also be accessed online using the official link of the 3DCityDB itself (without having to install anything except the browser):
https://www.3dcitydb.org/3dcitydb-web-map/latest/3dwebclient/index.html
Navigate to the toolbox to add a new building layer (see mini project 1 for instructions):
In the
URLtext field, add the following URL (which is the path to the KML/COLLADA/glTF of buildings in Munich hosted in the 3DCityDB file server):https://www.3dcitydb.org/3dcitydb/fileadmin/public/webmap_munich_cutout_sunpot/export_collada_MasterJSON.json
In the
Nametext field, add a name for the layer, such asMunich SolarThe following steps show how to enrich the visualization with thematic data:
In the text field
thematicDataUrl, add the following URL (which is the URL of PostgREST API of the 3DCityDB containing required thematic data):https://city-database.westeurope.azurecontainer.io/view_all_building_attributes
In the dropdown
> Thematic Data Source, selectPostgreSQL REST APIIn the drop down
> Table type, selectOne row per object attributeTip
The 3DCityDB Web Map Client allows two types of tables, namely vertical and horizontal:
In vertical tables, each row contains 3 columns: the ID of the object, the attribute name of this object and the value of this attribute. Since an object can have multiple attributes, there may be multiple rows of the same ID. The combination of IDs and attribute names must however be unique (i.e. the primary key is the combination of the first two columns). This is suitable for storing objects that have variable number of attributes but will produce a large number of rows. For vertical tables, use the option
One row per object attribute.Example of a vertical table¶ gmlid
attribute
value
gmlid1
attribute1
value1
gmlid1
attribute2
value2
gmlid1
attribute3
value3
gmlid1
attribute4
value4
gmlid2
attribute1
value1
gmlid2
attribute2
value2
gmlid2
attribute3
value3
gmlid2
attribute4
value4
In horizontal tables on the other hand, each row contains the ID of the object and the values of all of its attributes in each column. This means that each row uniquely represents exactly one object (i.e. the primary key is the column representing the IDs). This is suitable for datasets whose objects always have the same number of attributes and attribute names and also for datasets that have a large number of objects. For horizontal tables, use the option
All object attributes in one row.Example of a horizontal table¶ gmlid
attribute1
attribute2
attribute3
attribute4
gmlid1
value1
value2
value3
value4
gmlid2
value1
value2
value3
value4
For more information on the vertical and horizontal tables as well as their responses produced by PostgREST, please refer to the documentation.
Confirm by clicking
Add layerDouble-click on the layer name to fly to the layer
Click on any building to inspect its thematic data displayed in an infobox on the right-hand side of the screen
Tip
The object’s ID can also be found in the title/header of the infobox. This value corresponds to the buildings’ GMLID in the 3DCityDB.
The web map client also allows for displaying shadows of 3D building models. This can be activated or deactivated using the button
Toggle Shadowsin the second row from the bottom of the toolbox.Tip
The shadows are displayed depending on the time of day it is. By default, the current time is selected. To choose another date and time, click on the time on the speedometer in the bottom left corner of the screen. The clock speed can be changed by adjusting the speedometer. On the right of the clock is the timeline (which resembles a ruler). Move the mouse inside and then scroll up or down to navigate through the timeline (similarly to zooming in and out of a map). Move the pin to the left or right to see the shadows move.
The 3DCityDB Web Map Client also allows sharing your project:
Click on the button
Generate Scene Linkin the toolboxCopy the URL produced, now using this URL you can open the web client with the same contents as you have added on any machine that has access to the internet
Tip
The 3DCityDB Web Map Client even captures the current camera location, altitude as well as its pitch, roll and heading! Make sure you move your camera to a desired location and angle before generating a scene link.
The web client should now look like the following:
2.2 Formulate Queries to the 3DCityDB using PostgREST
In this task, you will be using the same PostgREST API introduced in the previous step to perform some simple analyses on a specific building in Munich.
Click on a random building you can find in the 3DCityDB Web Map Client you have set up in the previous step. Notice its GMLID shown in the infobox. Now, using the following base PostgREST API:
https://city-database.westeurope.azurecontainer.io/view_all_building_attributes
Note
The SQL view view_all_building_attributes contains a very large number of rows and should only be used with a filter (such as only for a specific building). This means that you should NOT open this link without any filter or limit in the browser, since it will take a long time to load and the results returned are very long.
Tip
Although JSON texts are relatively simple and easy to read, you can additionally use a JSON parser/formatter in your browser of choice to “beautify” the JSON responses from the following queries.
Query all attributes of the selected building. Describe what you observe in the JSON response, such as:
How is this JSON object structured?
Does this JSON response represent a vertical or horizontal table mentioned previously? Why?
What type of real-world information do the non-generic attributes represent (without the prefix
gen:in their name)?Among the generic attributes, can you guess which ones contribute to the calculation of solar potential of this building and what meaning do they have?
List all and only attribute names of this building (i.e. without attribute values and the building’s ID). The JSON response should look like this:
[
    {
        "attribute": "creation_date"
    },
    {
        "attribute": "gen:ags"
    },
    {
        "attribute": "gen:bldg_name"
    },
    {
        "attribute": "gen:citygml_function"
    },
    ...
]
In addition:
List all and only non-generic attribute names of this building.
List all and only generic attribute names of this building.
List all and only attribute names relevant to diffuse radiation of this building.
List all and only attribute names relevant to direct radiation of this building.
The solar potential of this building is the sum of the diffuse and direct radiation exposed to its walls and roofs.
Show the total solar potential, the total solar potential exposed to walls, the total solar potential exposed to roofs, the total diffuse radiation, the total diffuse radiation exposed to walls, the total diffuse radiation exposed to roofs, the total direct radiation, the total direct radiation exposed to walls and the total direct radiation exposed to roofs altogether during the entire year in question using only one request.
Do the numbers add up? State the mathematical relationships between these terms.
Tip
For more detailed information on the PostgREST API, please refer to the official documentation here.
2.3 Solar Potential Analyses using SQL
In this section, we will develop further and, in some cases, more complex queries for analyzing solar energy potentials. For the following analyses, we will design SQL queries that run on the 3D City Database directly. In order to connect to the already prepared database, we use the GUI tool pgAdmin.
2.3.1 Set up pgAdmin using Docker
pgAdmin is an administration and development tool for the PostgreSQL database. This tool is open source and enables us to access, inspect, examine and query 3D City Database instances. As pgAdmin is a web application, we can simply start it locally using Docker and open it with the browser on http://localhost:8080.
Docker command
# Unix
docker run --name <name_pgadmin_container> -p 8080:80 -d \
  -e PGADMIN_DEFAULT_EMAIL=postgres@example.com \
  -e PGADMIN_DEFAULT_PASSWORD=<password_pgadmin> \
  dpage/pgadmin4
# Windows
docker run --name <name_pgadmin_container> -p 8080:80 -d ^
    -e PGADMIN_DEFAULT_EMAIL=postgres@example.com ^
    -e PGADMIN_DEFAULT_PASSWORD=<password_pgadmin> ^
  dpage/pgadmin4
Description
-
<name_pgadmin_container>¶ The name of the Docker container for pgAdmin.
-
<password_pgadmin>¶ The password for accessing the pgAdmin web interface. Please change this to a secure value.
2.3.2 Connecting to the 3D City Database with pgAdmin
Open http://localhost:8080 with your browser and login using your previously defined credentials.
Create a server connection:
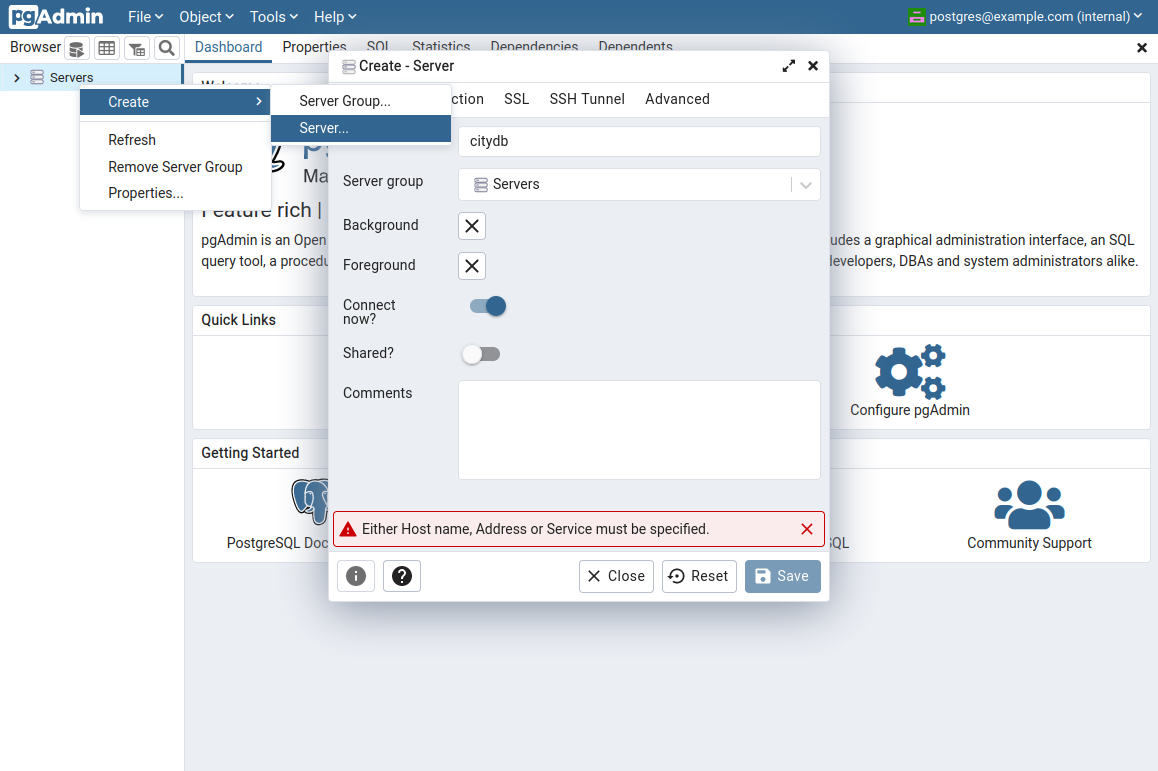
Use the following configurations in the general and connection tab:
Name: Freely choosable
Hostname: will be provided via Moodle
Port:
5432Username: will be provided via Moodle
Password: will be provided via Moodle
Navigate to the tables of the 3D City Database:
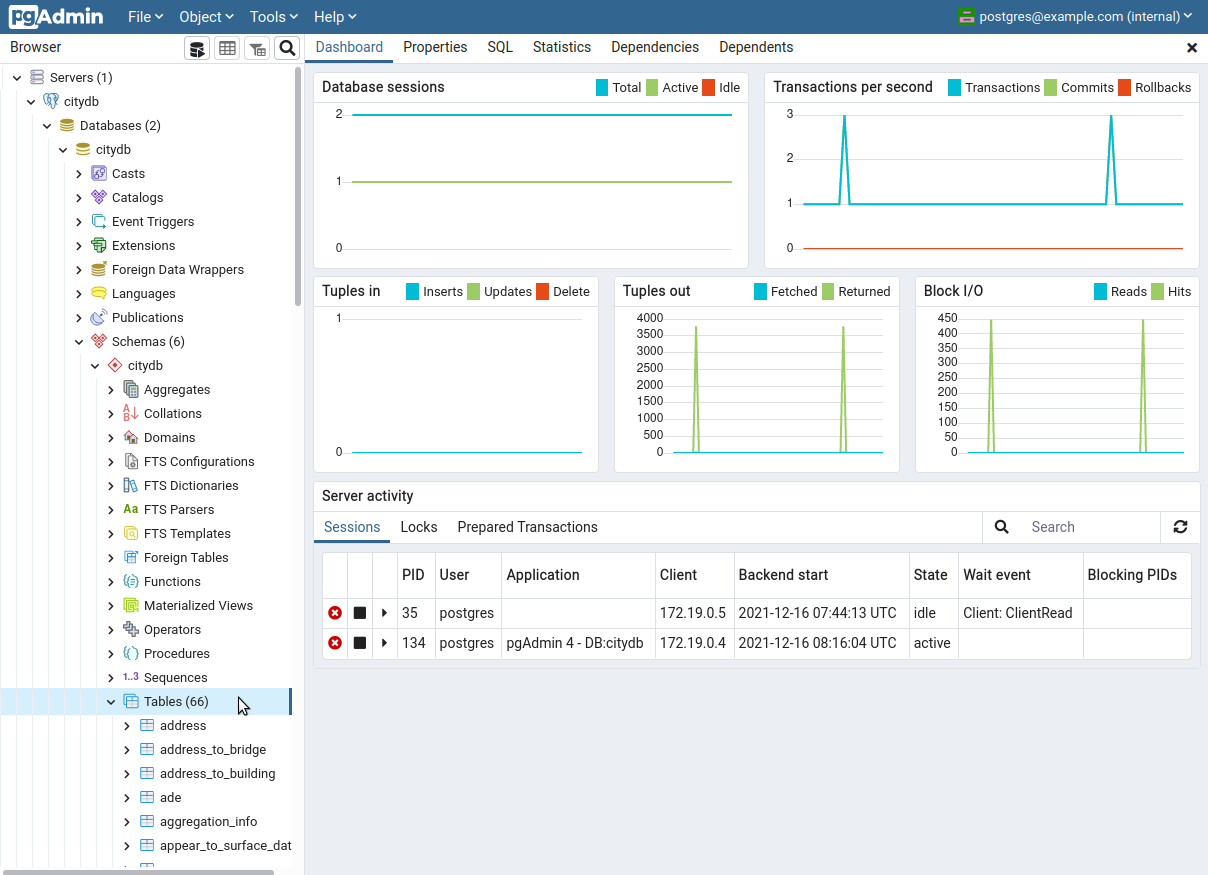
2.3.3 Accessing information and executing queries
Inspect a table by View/Edit Data -> First 100 Rows (selecting All rows will take a while):
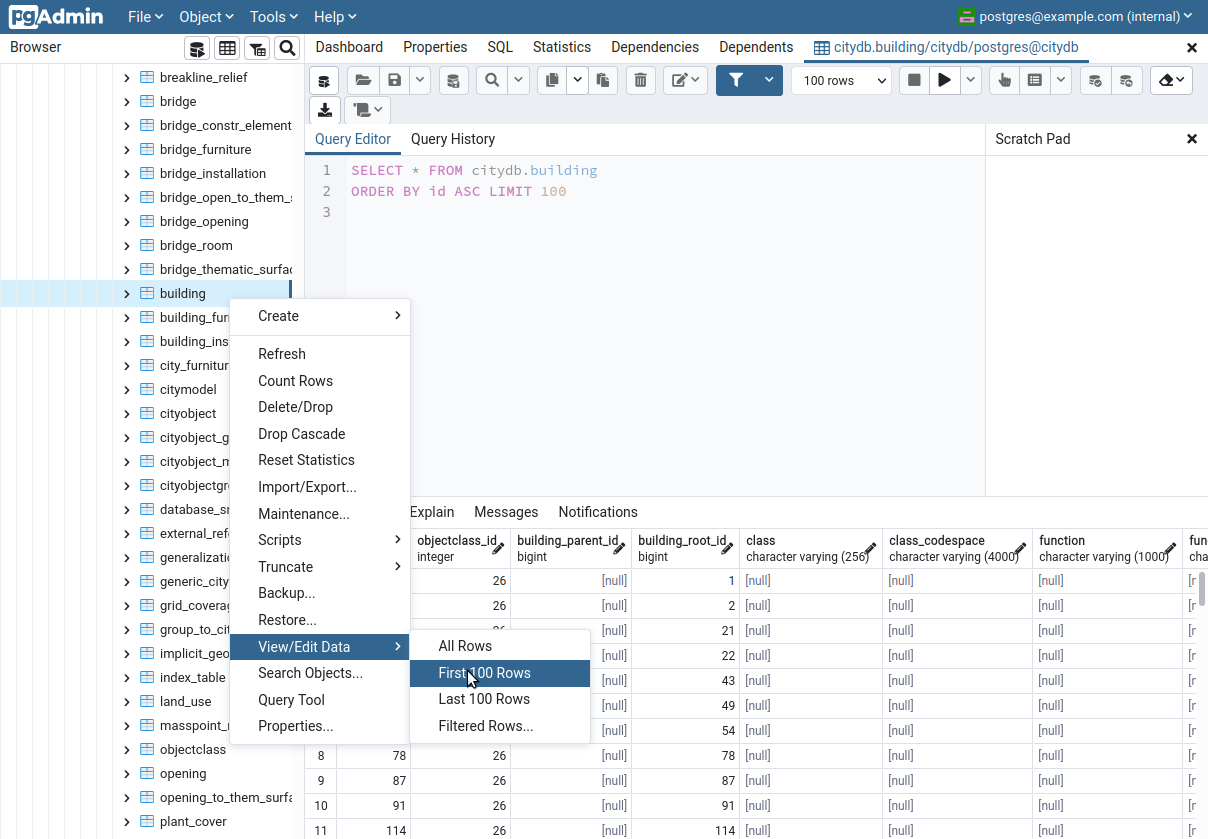
You can start a querying tool to write SQL statements:
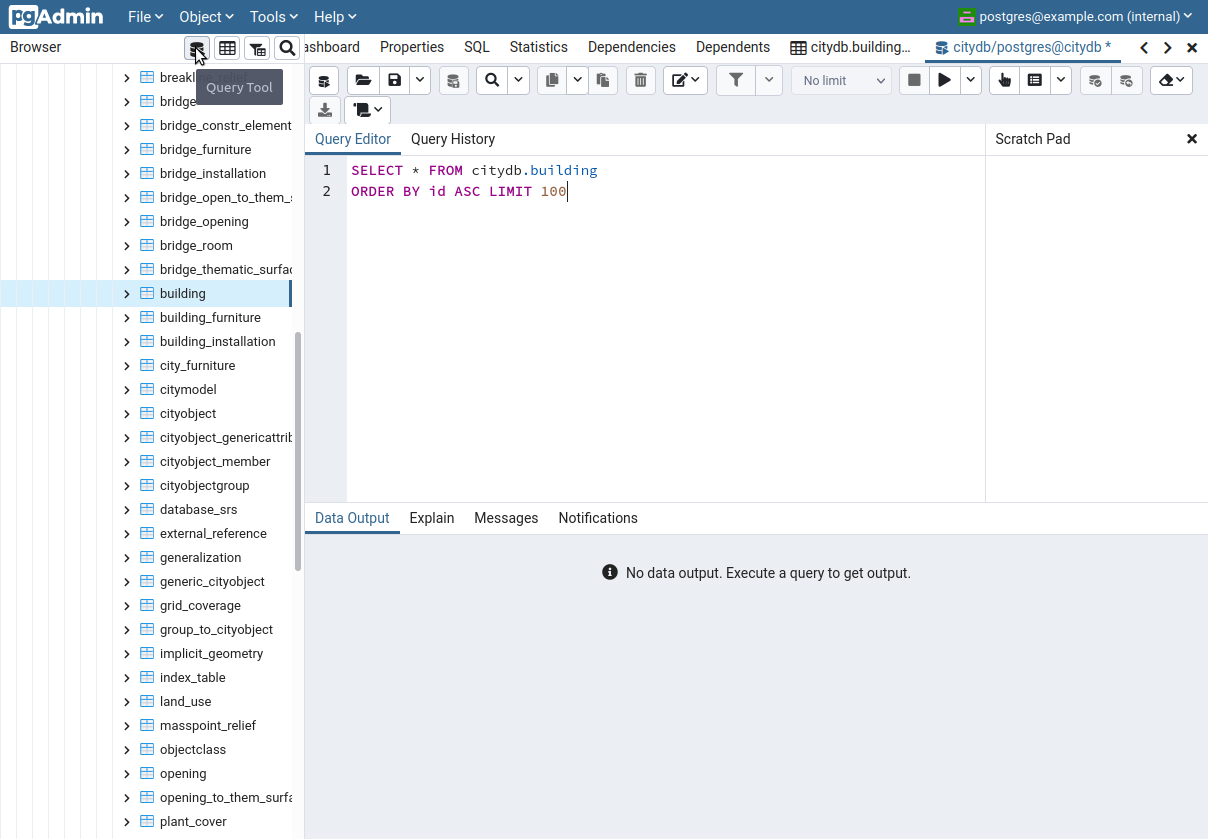
Then write the following SQL query:
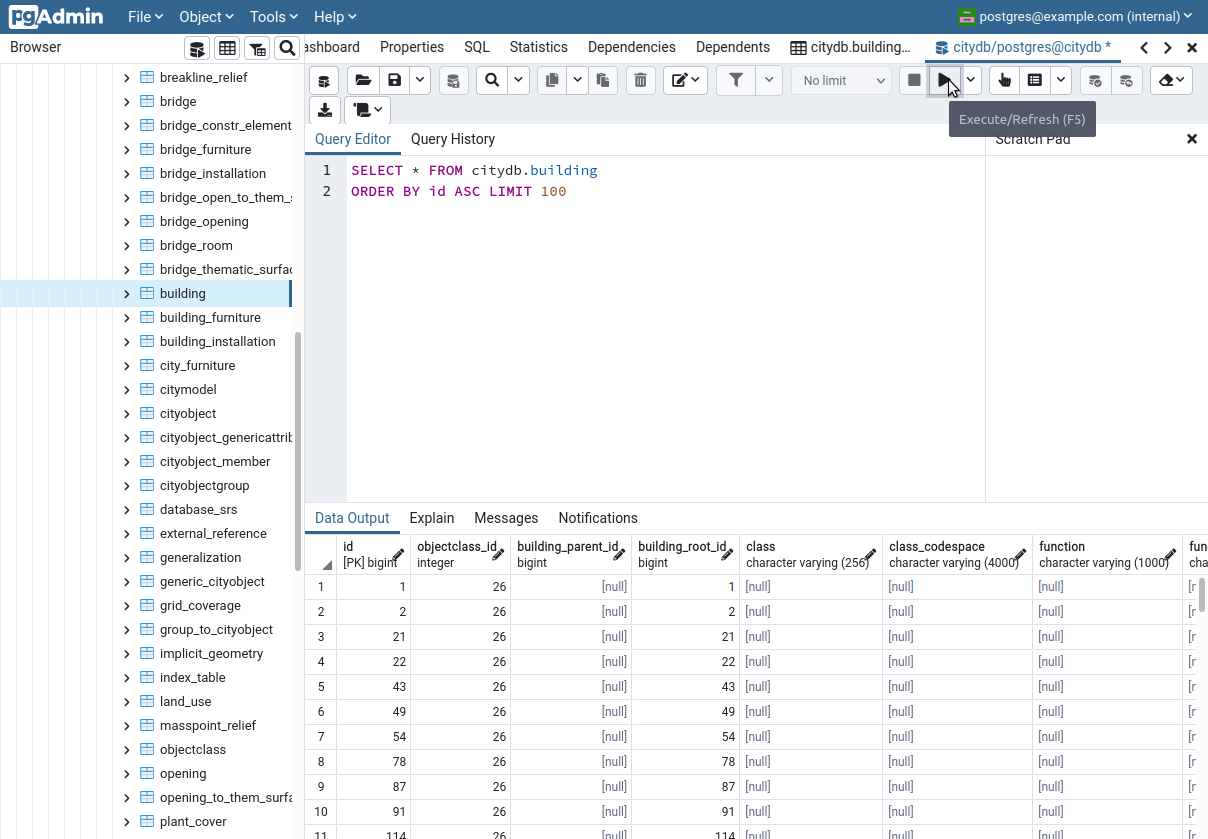
SELECT * FROM citydb.building
ORDER BY id ASC LIMIT 100
After clicking on execute, you should see the result of your query:
2.3.4 Explanation of the tables
The 3D City Database contains over fifty tables, which store the information of the city model. A documentation of the database schema can be found here.
For our project only the following tables are relevant:
cityobject: Common information (GML ID, object class id, …) for each feature.
cityobject_genericattrib: Generic attributes (e.g. solar potential values) which are attached to city objects.
objectclass: Relations between object class names, ids and tables.
surface_geometry: Contains all the surface geometries across different features.
building: Contains building features.
thematic_surface: Containes features, such as walls, roofs, ground surfaces.
To write SQL queries for PostgreSQL in general this tutorial and the official documentation can be helpful. Moreover, the extension PostGIS is also installed in the database. The extension provides additional GIS functions for writing SQL statements, which are documented here.
2.3.5 Formulate queries using SQL
Analyzing buildings
Write a SQL query to count all available buildings in the database and provide a link to the documentation of the SQL function you used.
Is the counting function, which you used in task a, part of the PostgreSQL database itself or of the PostGIS extension? Why?
What information is stored in the column objectclass_id (in the table you just used)? How can these values be interpreted?
What numbers are stored in the column id? What is the relationship between the table you just used and the table cityobject?
Analyzing roofs
Write a SQL query that counts all available roof surfaces with SQL.
Which table(s) do you need? Describe why you can’t just count all the rows?
Write a SQL statement only using a string (e.g. ‘BuildingRoofSurface’) as input without any numbers in the statement.
Analyze radiation values
Provide a SQL statement for the ten highest direct radiation values of month May found in table cityobject_genericattrib and sorted descending.
Describe all the functions you used.
What does the column cityobject_id refer to?
Is this column also available in the table surface_geometry?
Geometric operations
Write a SQL statement making the geometries in surface_geometry human readable.
Tip
The PostGIS extension provides a wide range of SQL functions for handling geometry objects, which are documented here.
What does WKT mean?
What are spatial indexes? When and why are they relevant?
Write a SQL statement calculating the footprint area of each surface.
Tip
Since the exercise is intended to gain a general understanding, the LIMIT function can be used to reduce the computation time.
Let’s assume you are standing on the viewing plateau of St. Peter (position in EPSG:25832:
691607.028, 5334679.918, 570.0) and want to know how many wall surfaces you can see with your newly developed X-ray vision device (235m range). Write a SQL statement for verifying that your new technology is working correctly.
Tip
The analysis should take place in 3D and only wall surfaces should be counted which are fully contained in the visibility range. To simplify the query, object class id numbers are allowed.
Is it possible to represent this query also as a PostgREST request? Why?
Advanced queries
Provide a SQL statement for finding the GML ID of the building with the highest yearly global radiation per square meter in the database.
Tip
It is worth considering all the generic attributes that are available. Subqueries can be helpful when following divide-and-conquer strategies.
Write a SQL statement for finding the GML ID of the building with the highest yearly global radiation per square meter within a 150m radius of the position: longitude 11.564222, latitude 48.146041 (WGS 84), height 530.
Tip
The city model is provisioned using EPSG:25832 as coordinate reference system.
2.4 Group Report
Your report must answer the following questions:
The following questions refer to 2.1 Enrich Visualization with Thematic Data:
Why do the building models now look different than those you’ve seen in the web client from the first mini project? What are the meanings of the colors shown? What causes some places to have the color light orange, while others dark blue?
Please include a URL of your 3DCityDB Web Map Client instance together with a screenshot of exactly where this URL was generated.
Note
Please choose the location and camera angle randomly so that no two groups produce the same results.
The following questions refer to 2.2 Formulate Queries to the 3DCityDB using PostgREST:
Follow all the steps and answer their questions. Please provide screenshots/snippets of your JSON results.
Note
In addition to the answers, please also give your PostgREST queries as plain texts in the report (i.e. please do not use masked hyperlinks where the URLs cannot be seen directly, such as this, instead write its URL directly, such as https://tum.de).
The following questions refer to 2.3 Solar Potential Analyses using SQL:
Follow all the steps and answer their questions. Please provide screenshots/snippets of your pgAdmin results.
Note
In addition to the answers, please also give your SQL queries as plain texts in the report.
What’s the difference between the PostgREST (via HTTPS GET requests) and the SQL (in pgAdmin) approach when querying the city model? Which approach is used when?
And finally, some general questions:
How long did it take you to complete all the tasks (reading and understanding, preparing, executing commands, etc.)? How did you manage/divide the work within your group?
Note
It is important to provide a clear overview of who was responsible for which part. You must plan well in advance to ensure everyone can contribute to the group work equally. A well thought-out plan enables both group work and parallel individual work performed by each member.
What are the problems you encountered while conducting the mini project and how did you solve them?
What are the most interesting things you learned from the mini project?
Tip
Please submit your written report in PDF in Moodle using the following naming scheme:
Mini_Project_2_Group_NN.pdfPlease submit your report no later than 9:45 o’clock on Friday, Jan 19.
Your report must be carefully written and formatted. Typos, grammatical errors and layout problems will lead to points deduction.
Please include the first names, last names and matriculation numbers of all team members in the report.
It is sufficient to submit ONCE per group.