3 Mini Project 3
In the last mini project we developed queries to the city model database, while in this mini project we will take a closer look at the preparation processes of geospatial data for other applications. Generally, there are numerous different applications in various domains benefitting from environment models, such as simulation tools or simply visualization applications. Since such applications usually require differently structured input data in respect of their geometry, topology, semantics as well as their appearance, it is often necessary to prepare and process the source datasets by means of ETL processes.
In this mini-project, we will develop an ETL process to combine various geospatial datasets, transform them and then load them into another target application. As an example target application, we will use a computer graphics application of your choice, such as the Unreal Game Engine, Blender or a web-based model viewer. The objectives of this mini project are to:
3.1 Inspect the City Model with the Solar Potential Analysis
3.2 Inspect the Ingolstadt Datasets
3.3 Prepare the Geodata for a Graphics Application
3.4 Import into the Graphics Application
3.5 Conceptualize Your Project
3.1 Inspect the City Model with the Solar Potential Analysis
3.1.1 Install FME
To extract, transform, and load geodata or generally data, we will use Safe Software’s Feature Manipulation Engine (FME) in this mini project. In the geospatial sector, it is a widely used tool for inspecting data as well as for the development of spatial ETL processes. Students can get a Student Use License free of charge from this link.
Warning
The application for a free student license may take one working day. Please let us know if there are any issues.
Note
While Safe Software offers FME versions specifically for usage in the cloud, we will use FME Desktop as it is particularly suitable for developing prototypical transformations.
Even though FME is offered for every operating system, the use on the Windows operating system is preferable, since some functionality is only available there.
3.1.2 Inspect the Dataset
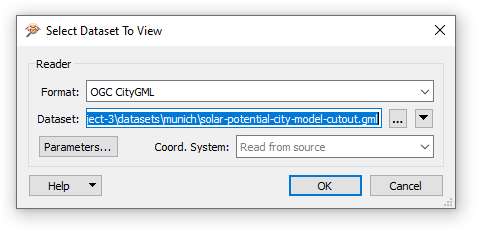
Open the CityGML dataset of Munich with the FME Data Inspector. If you right click on the file in the File Explorer, you should see the option Inspect with FME Data Inspector. Make sure to select OGC CityGML in the opening dialogue:
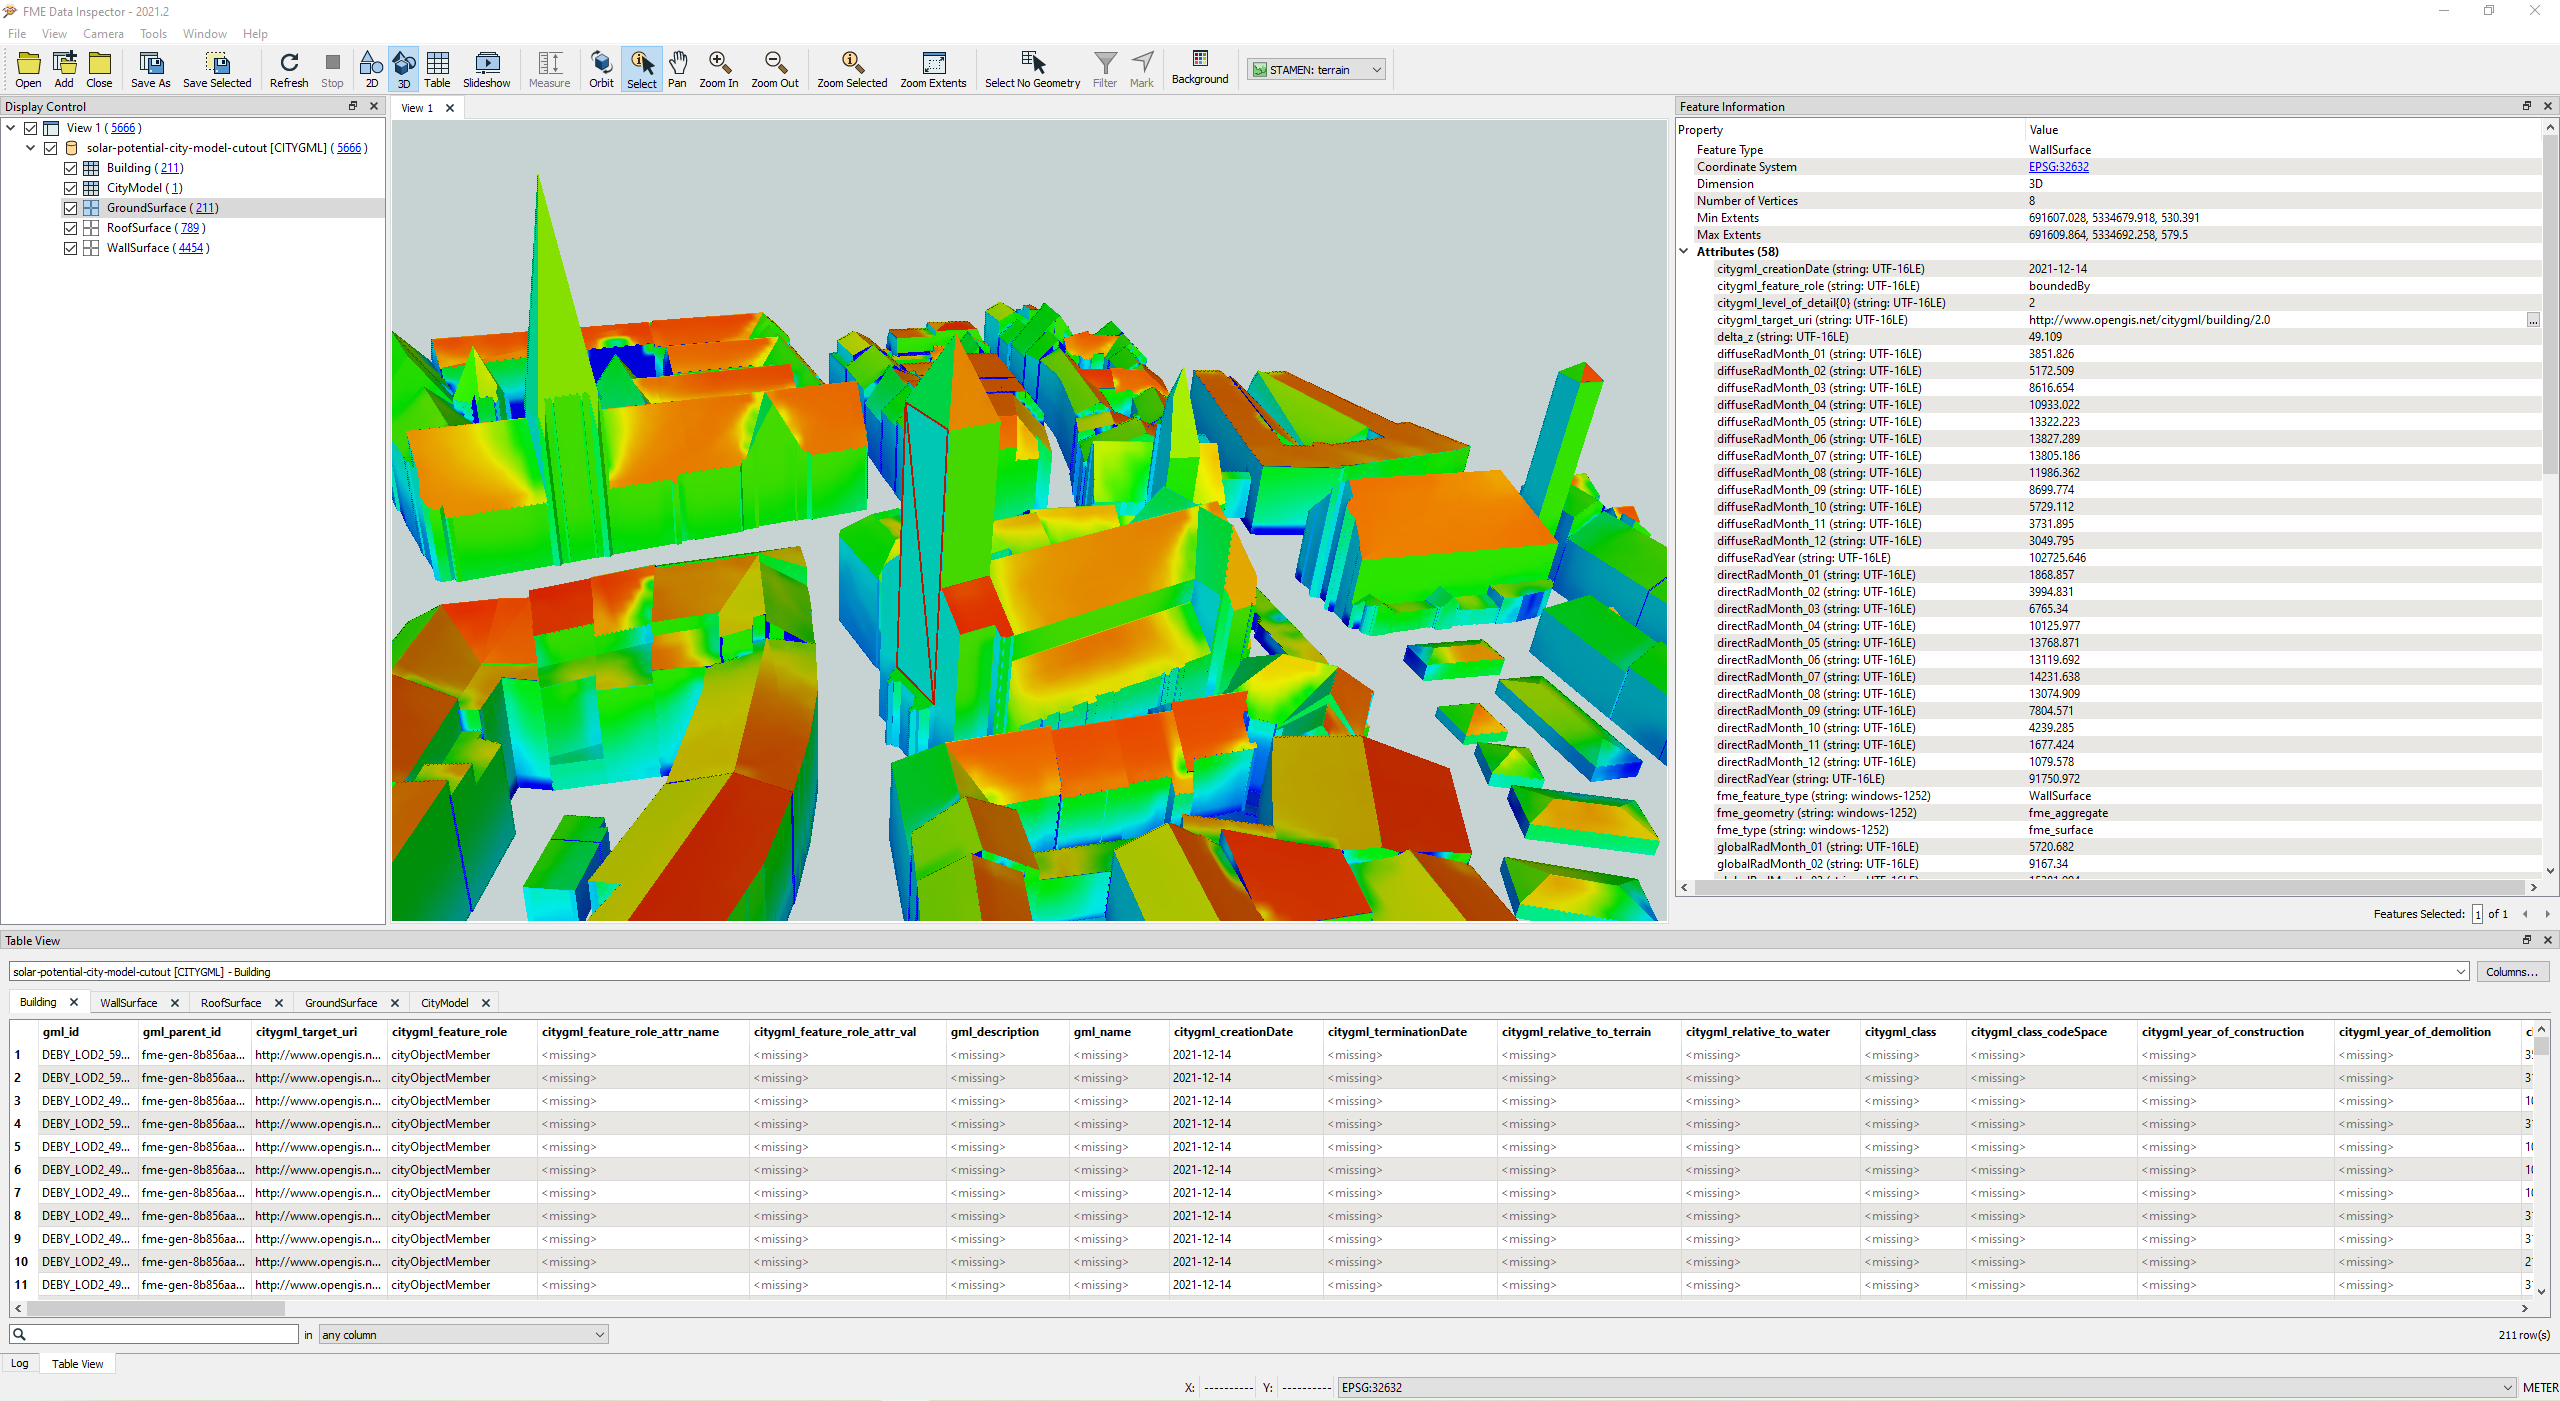
After about 5 minutes the 3D city model should be loaded in FME and ready for inspection. For the 2D view, you can add a background map by clicking Add Background Map and then selecting Stamen Maps and terrain. When you select the 3D view, you should see the following window:
For a short introduction into the components of the FME Data Inspector, please refer to this page.
Dataset inspection
Provide a list of all feature types that are present in the dataset. Which of these feature types have a geometric representation in this dataset?
How many buildings and how many wall surfaces are contained in the dataset?
What is the association (aggregation or inheritance) between the class
Buildingand the classRoofSurface?
Note
Refer to the CityGML standard (version 2.0) on page 4.
The roof surface, wall surface and building objects hold attributes that were computed by the solar potential analysis (directRadMonth_*, diffuseRadMonth_*, …). Suppose the building objects would not contain radiation values: How could the radiation values be calculated from the other feature types?
3.1.3 Build your First ETL Process
For the first ETL process, let’s suppose that you want to notify residents or owners that their balcony would be suitable to be equipped with a solar panel. For simplicity, let’s suppose that only balconies on wall surfaces that receive direct radiation of at least 27kWh/m^2 averaged over the month of May are eligible for solar panels. In order to plan your route for personal conversations with the residents, you need a list as a CSV file with the radiation value, the building and wall ID, and the point geometry coordinates.
Start your FME Workbench program and create a new workspace.
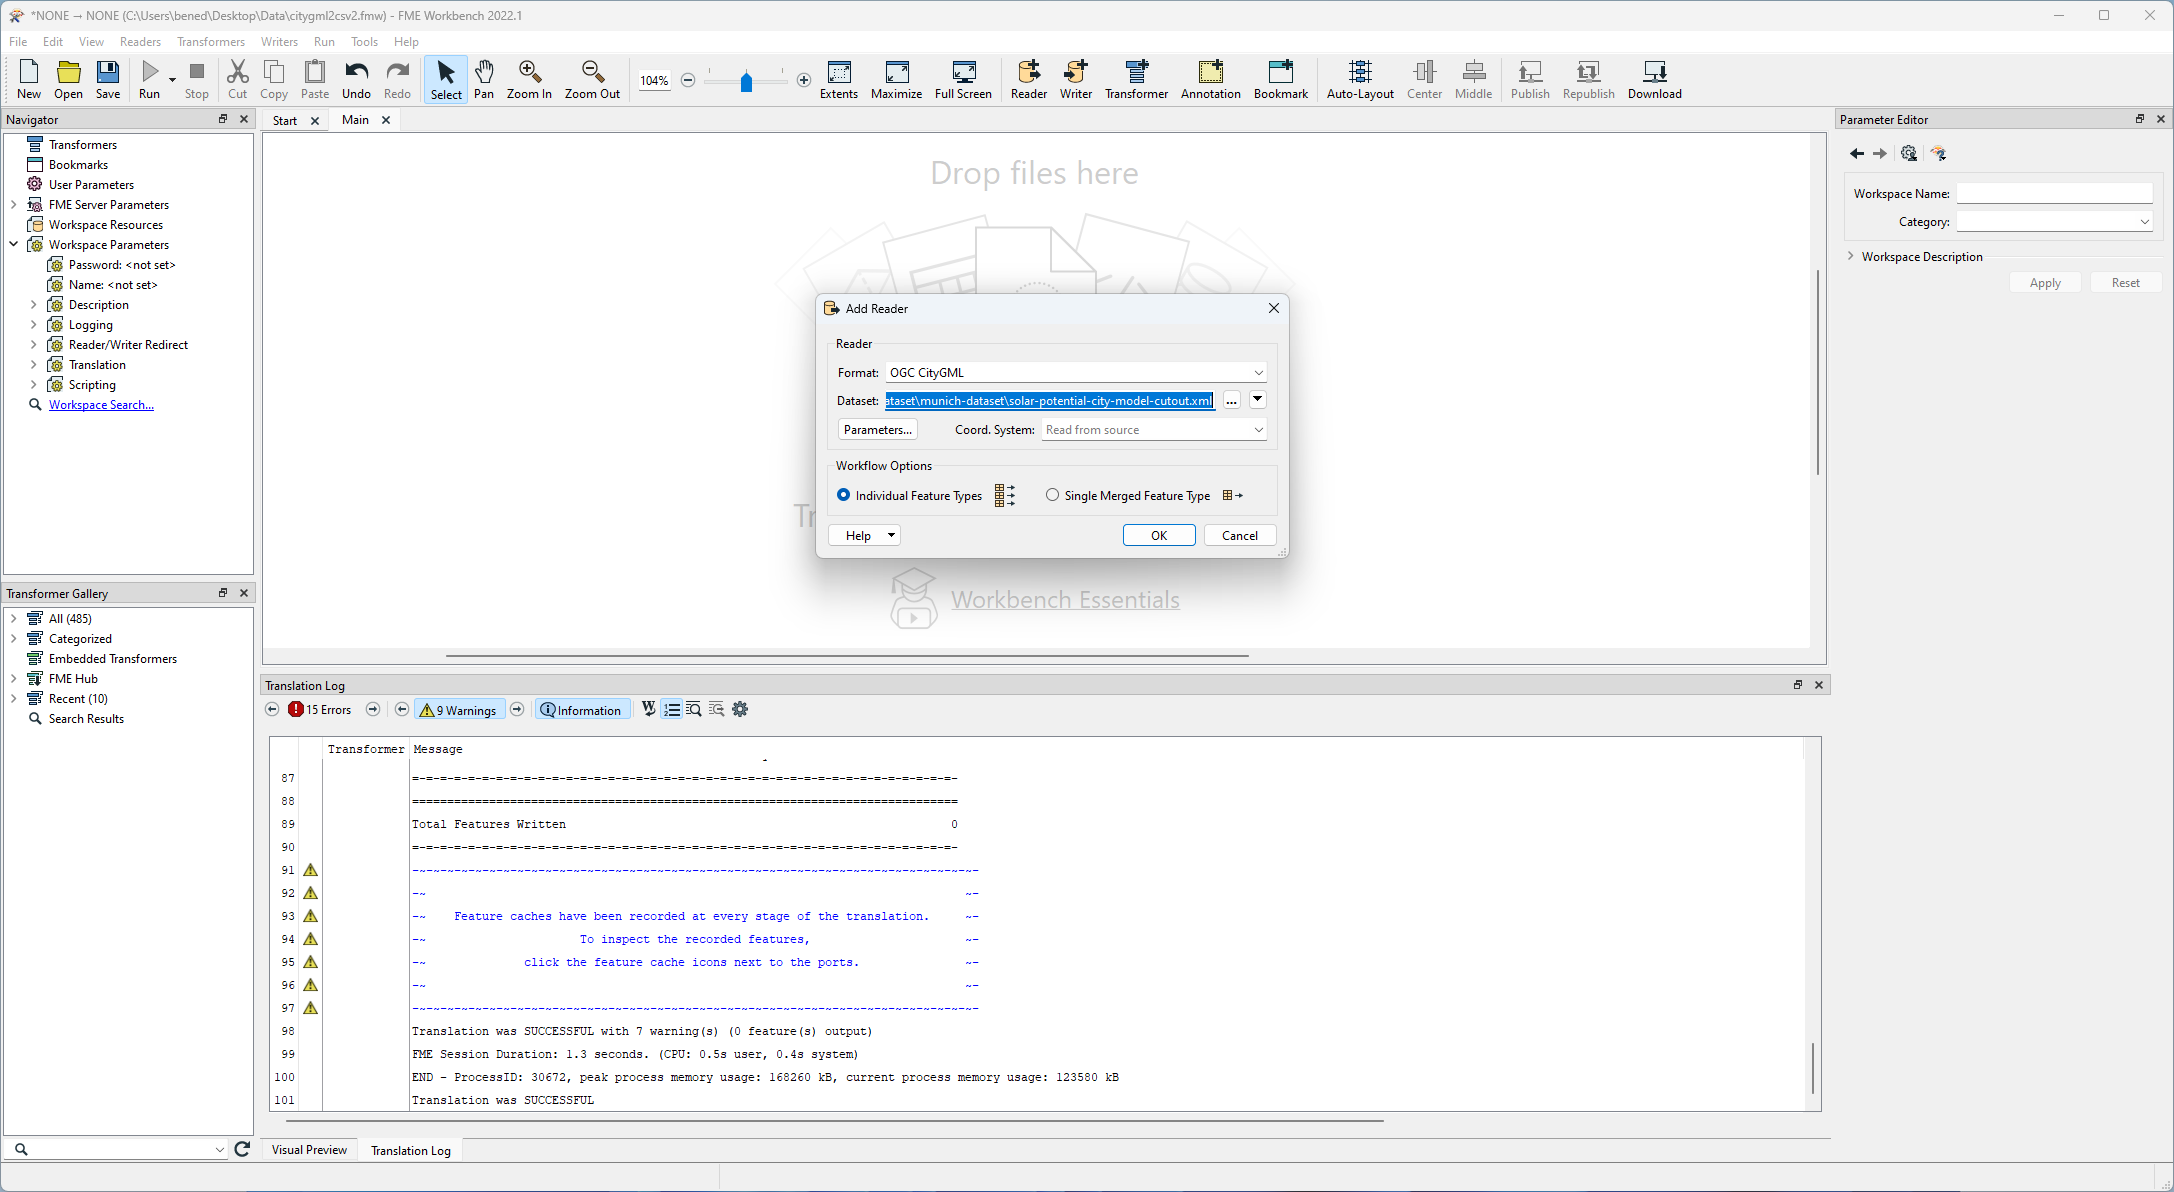
After that click add a new reader by clicking Reader and select the road space model dataset (filename: 2021-04-solar-potential-city-model-cutout.xml).
The dialogue should look similar to this one:
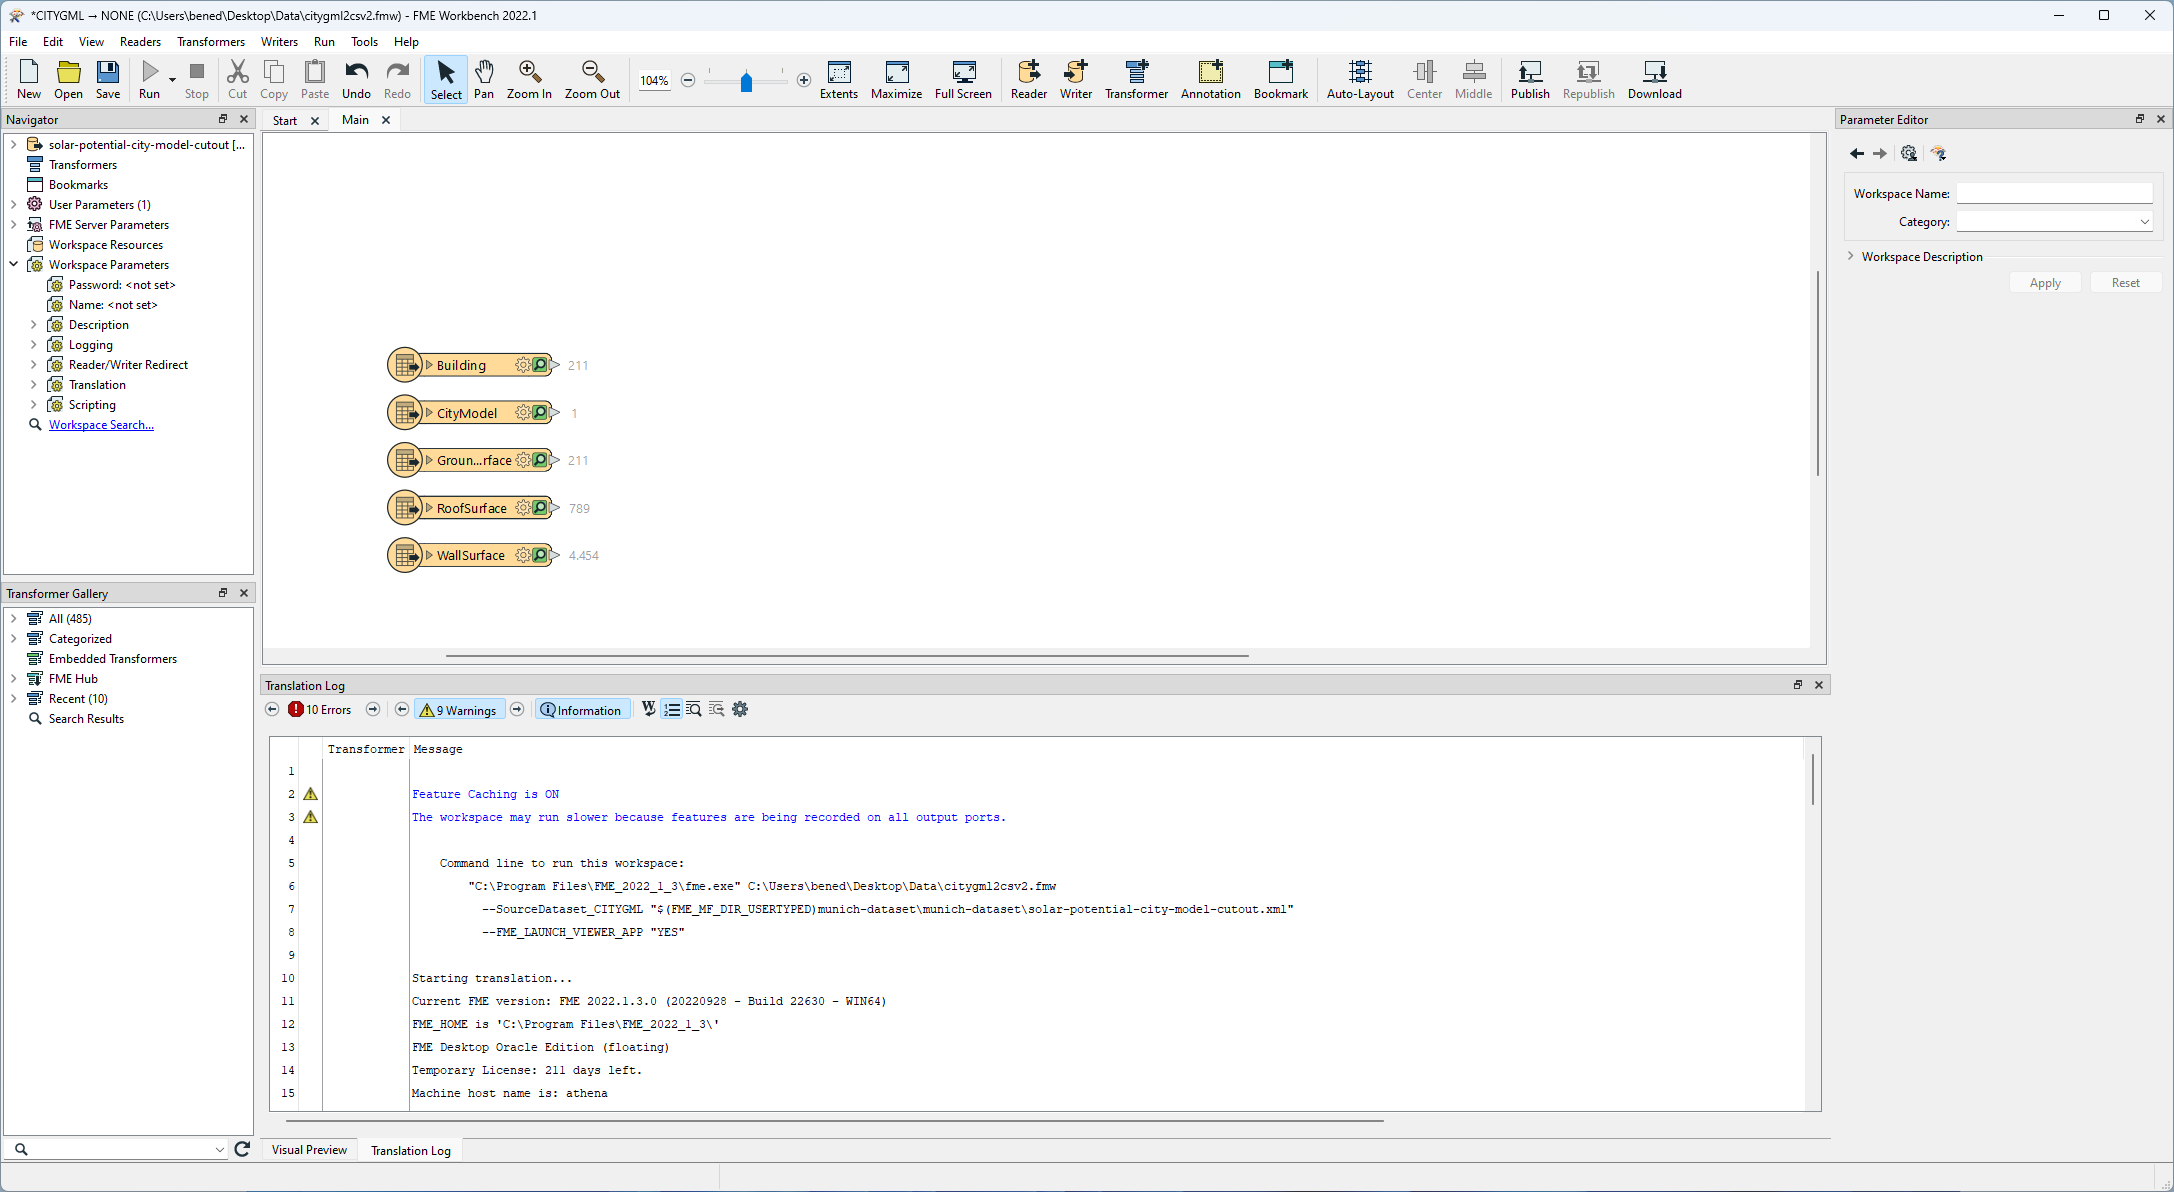
After selecting all feature types, each feature type of the dataset should have an individual reader:
Create a new attribute named directRadMonth_05_per_area calculating the direct radiation per surface area for each WallSurface feature by utilizing the AttributeCreator transformer and connecting the respective readers to it:
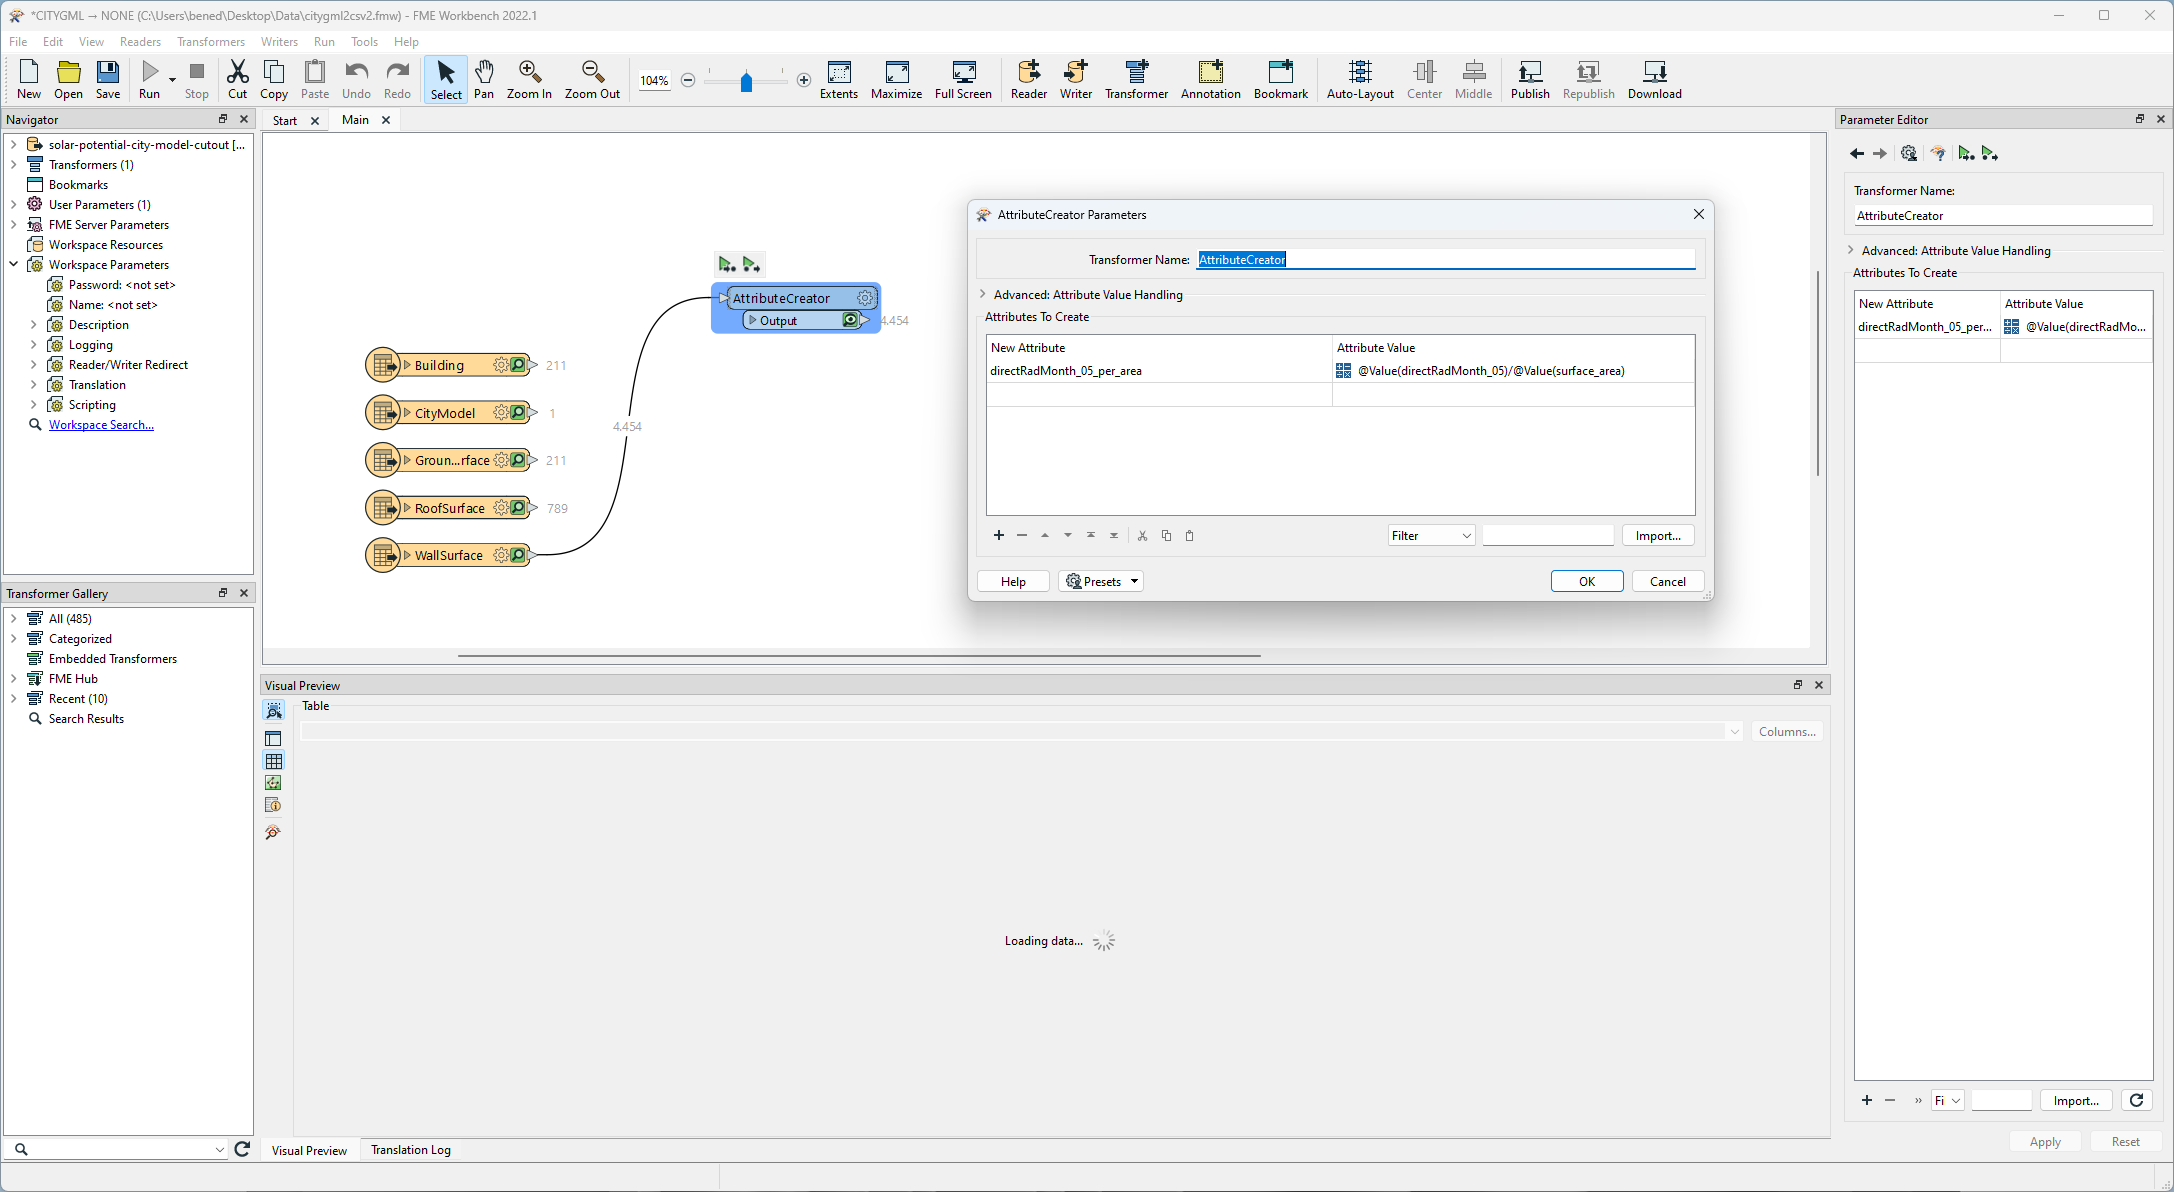
Note
Sometimes features are rejected during transformer processing, resulting in an overall stop of the workspace run. You can change this behavior in Navigator -> Workspace Parameters -> Translation -> Reject Feature Handling -> Continue Translation (see also this blog entry).
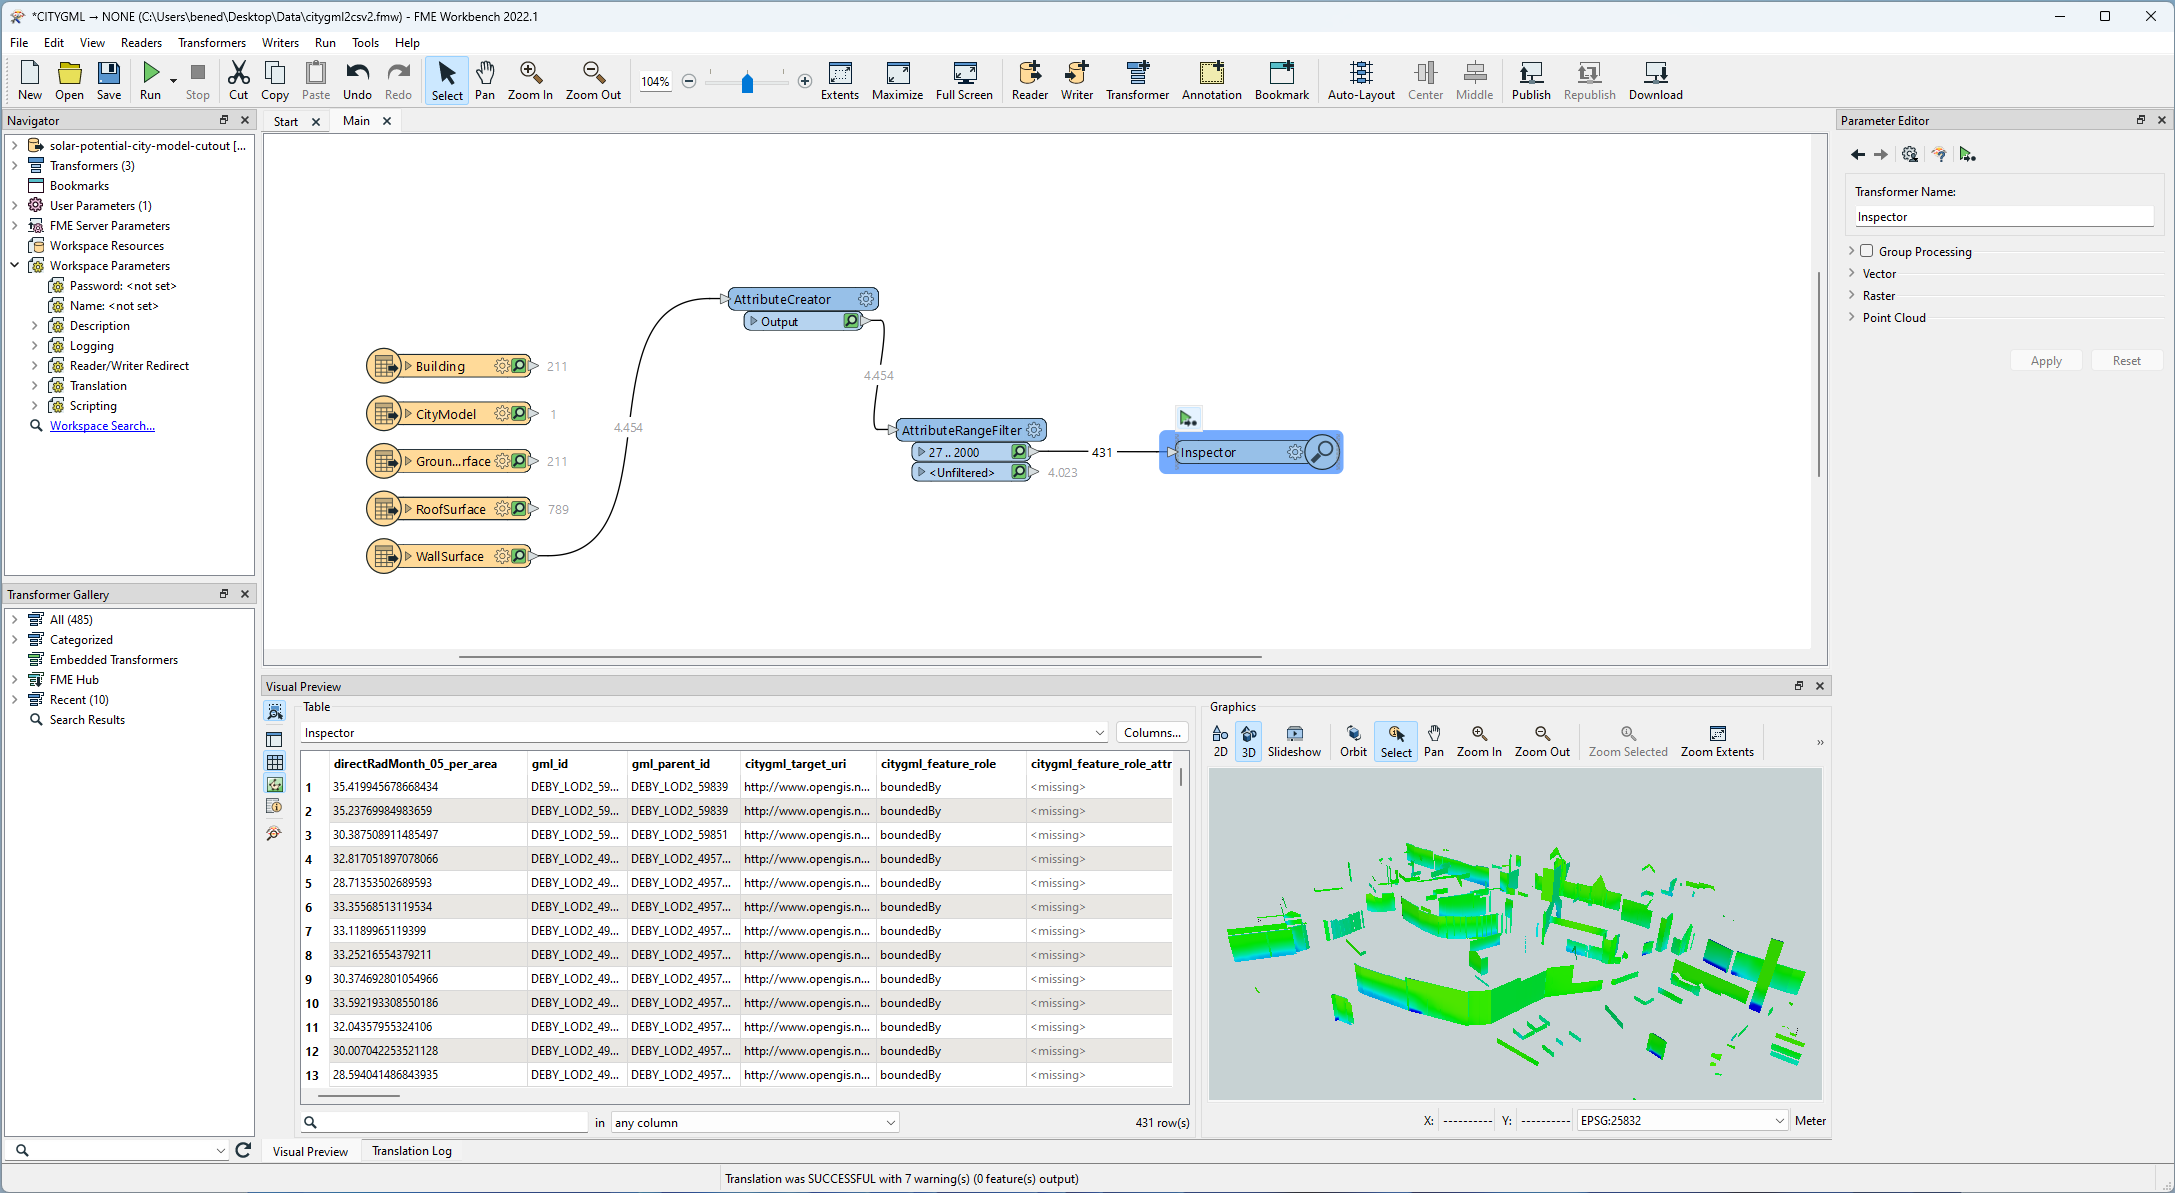
Add an AttributeRangeFilter for 27-2000 and an Inspector to inspect your intermediary result.
Hit the Run button of the inspector and wait a few seconds.
After completion, you should see some preliminary results (you can also click on the small green lens next to 27..2000 numbers of the AttributeRangeFilter transformer):
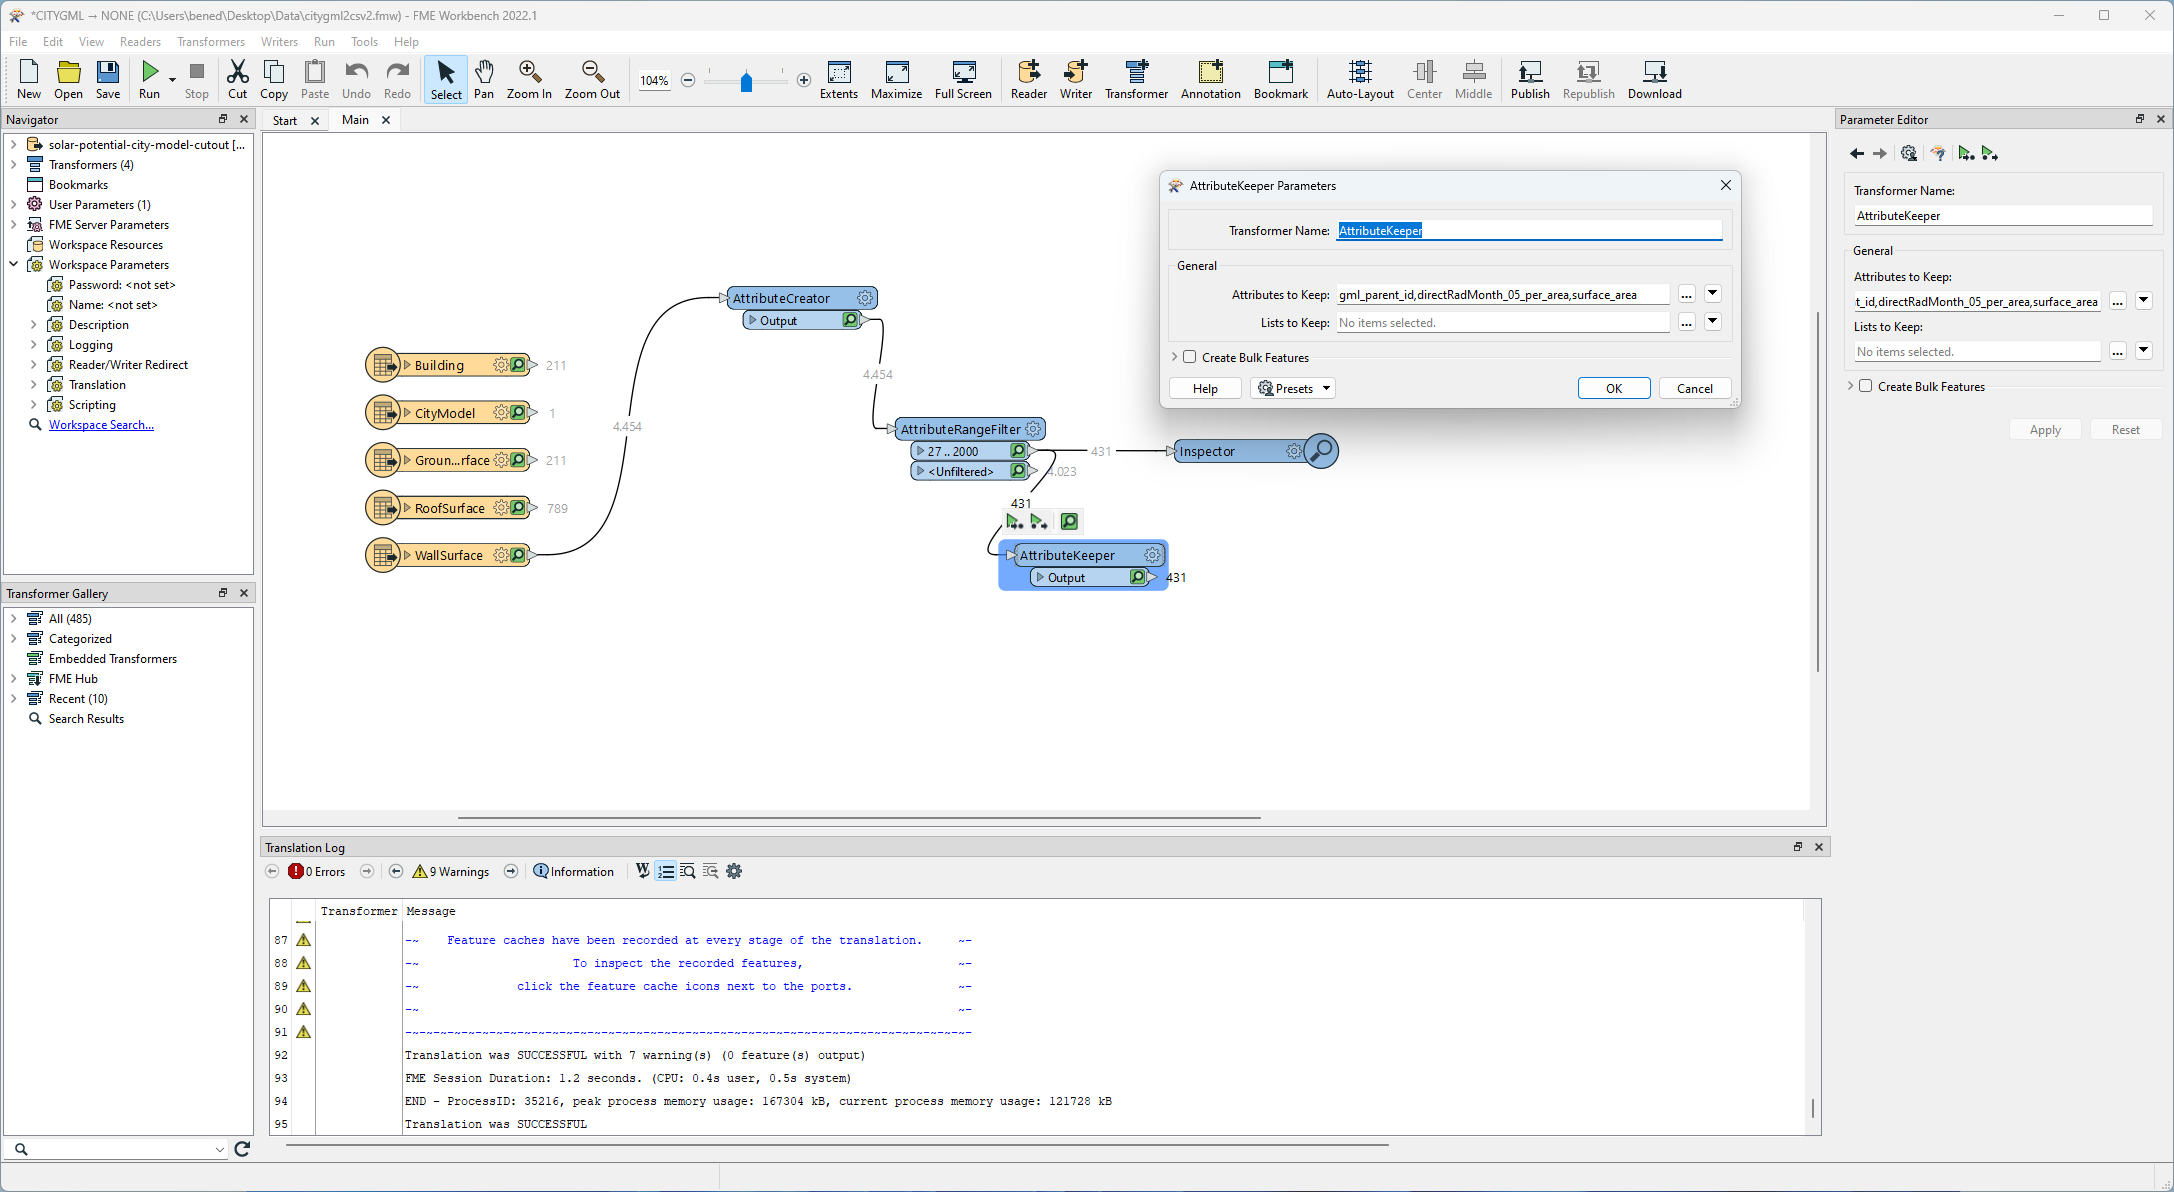
To keep only the attributes you are interested in (gml_parent_id, gml_id, directRadMonth_05_per_area, surface_area) use the AttributeKeeper transformer:
Extract the center point of the wall geometry and add them to the feature’s attributes using the CenterPointExtractor. Then, add a CSV file writer using the automatic definition as follows:
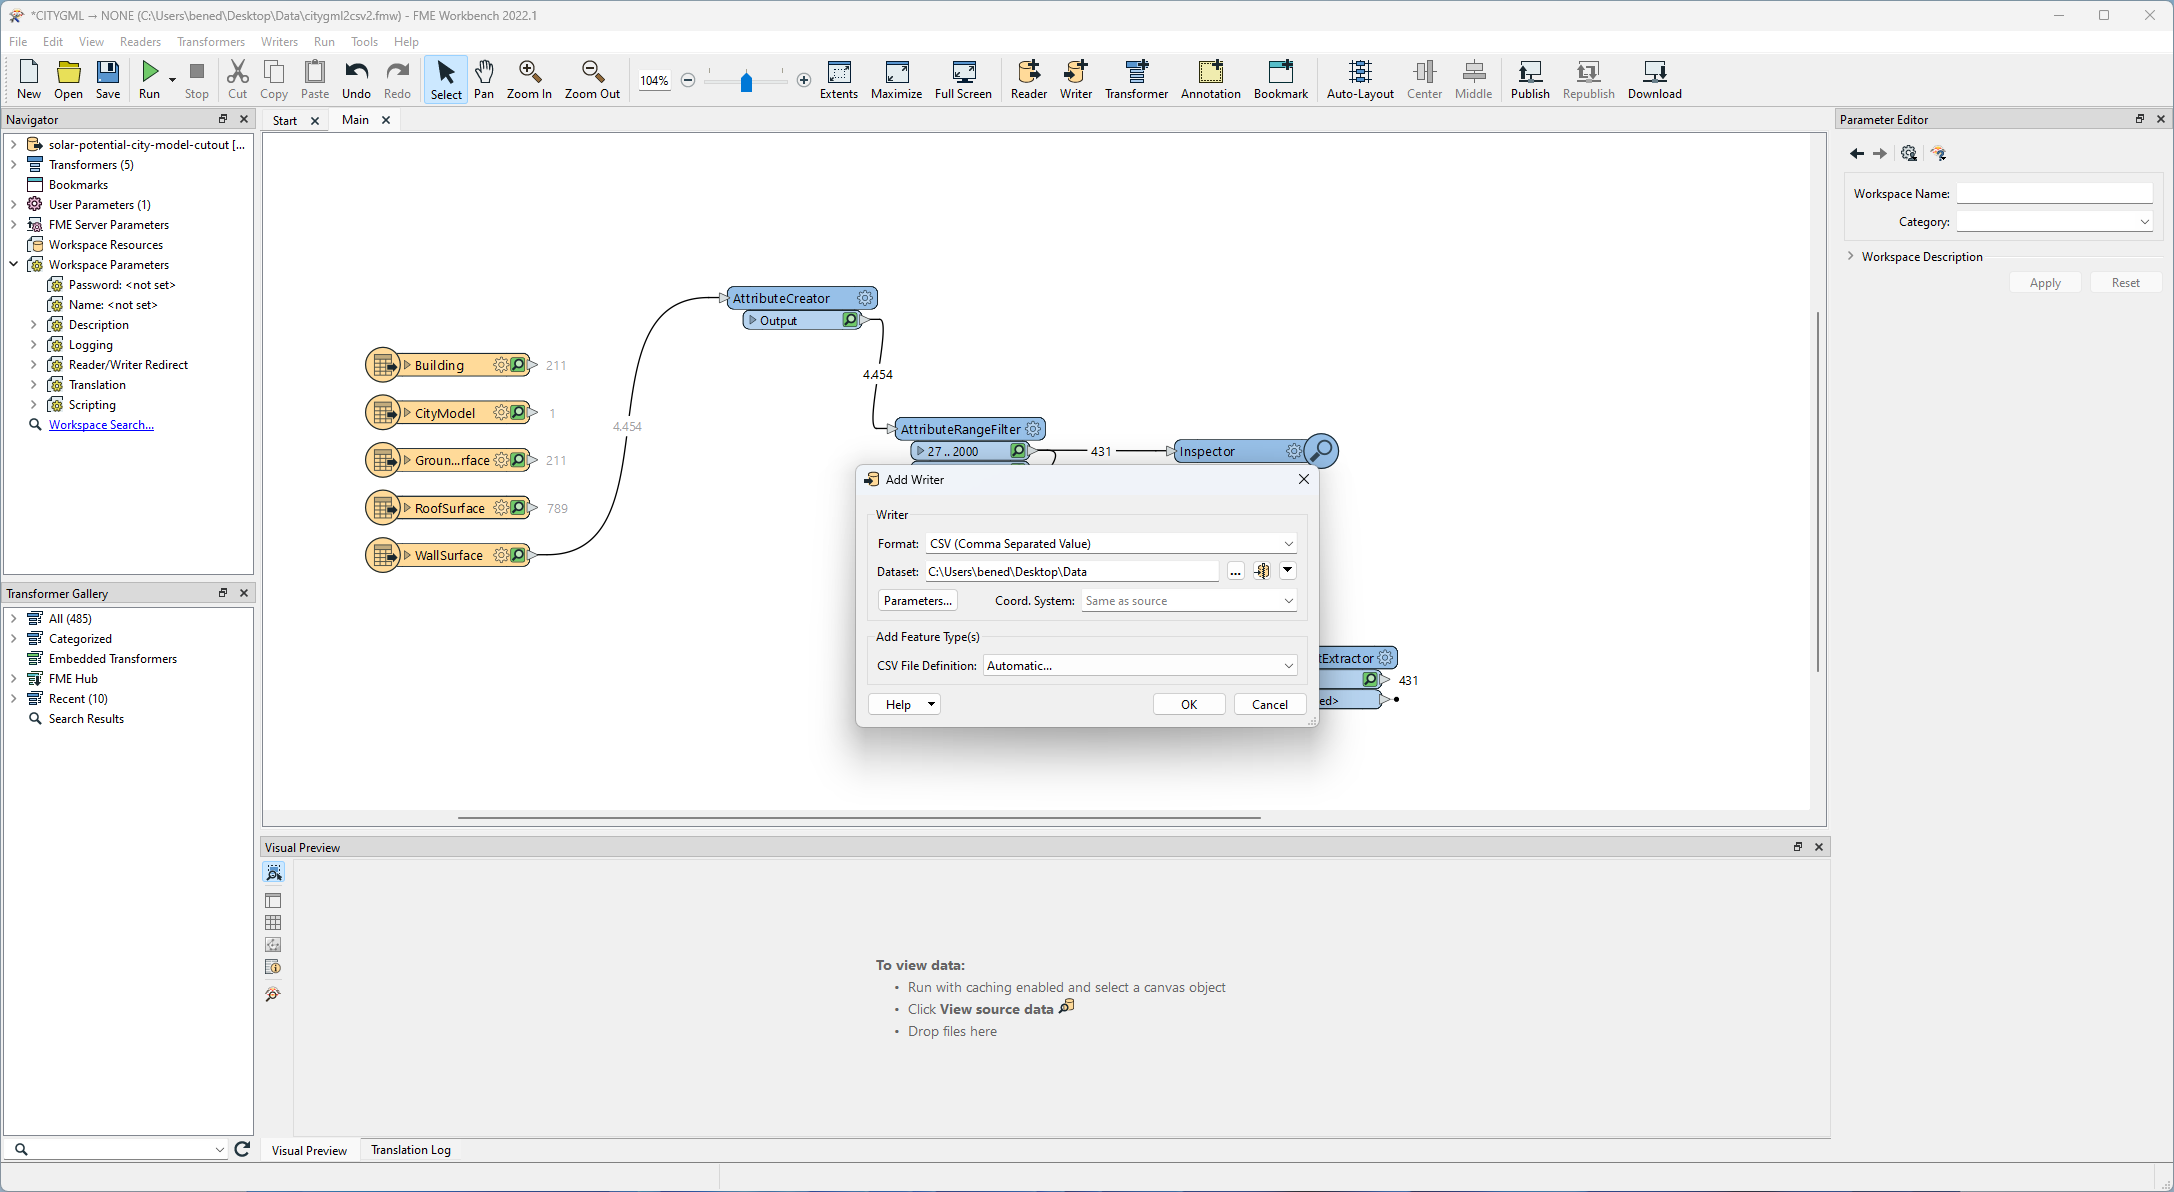
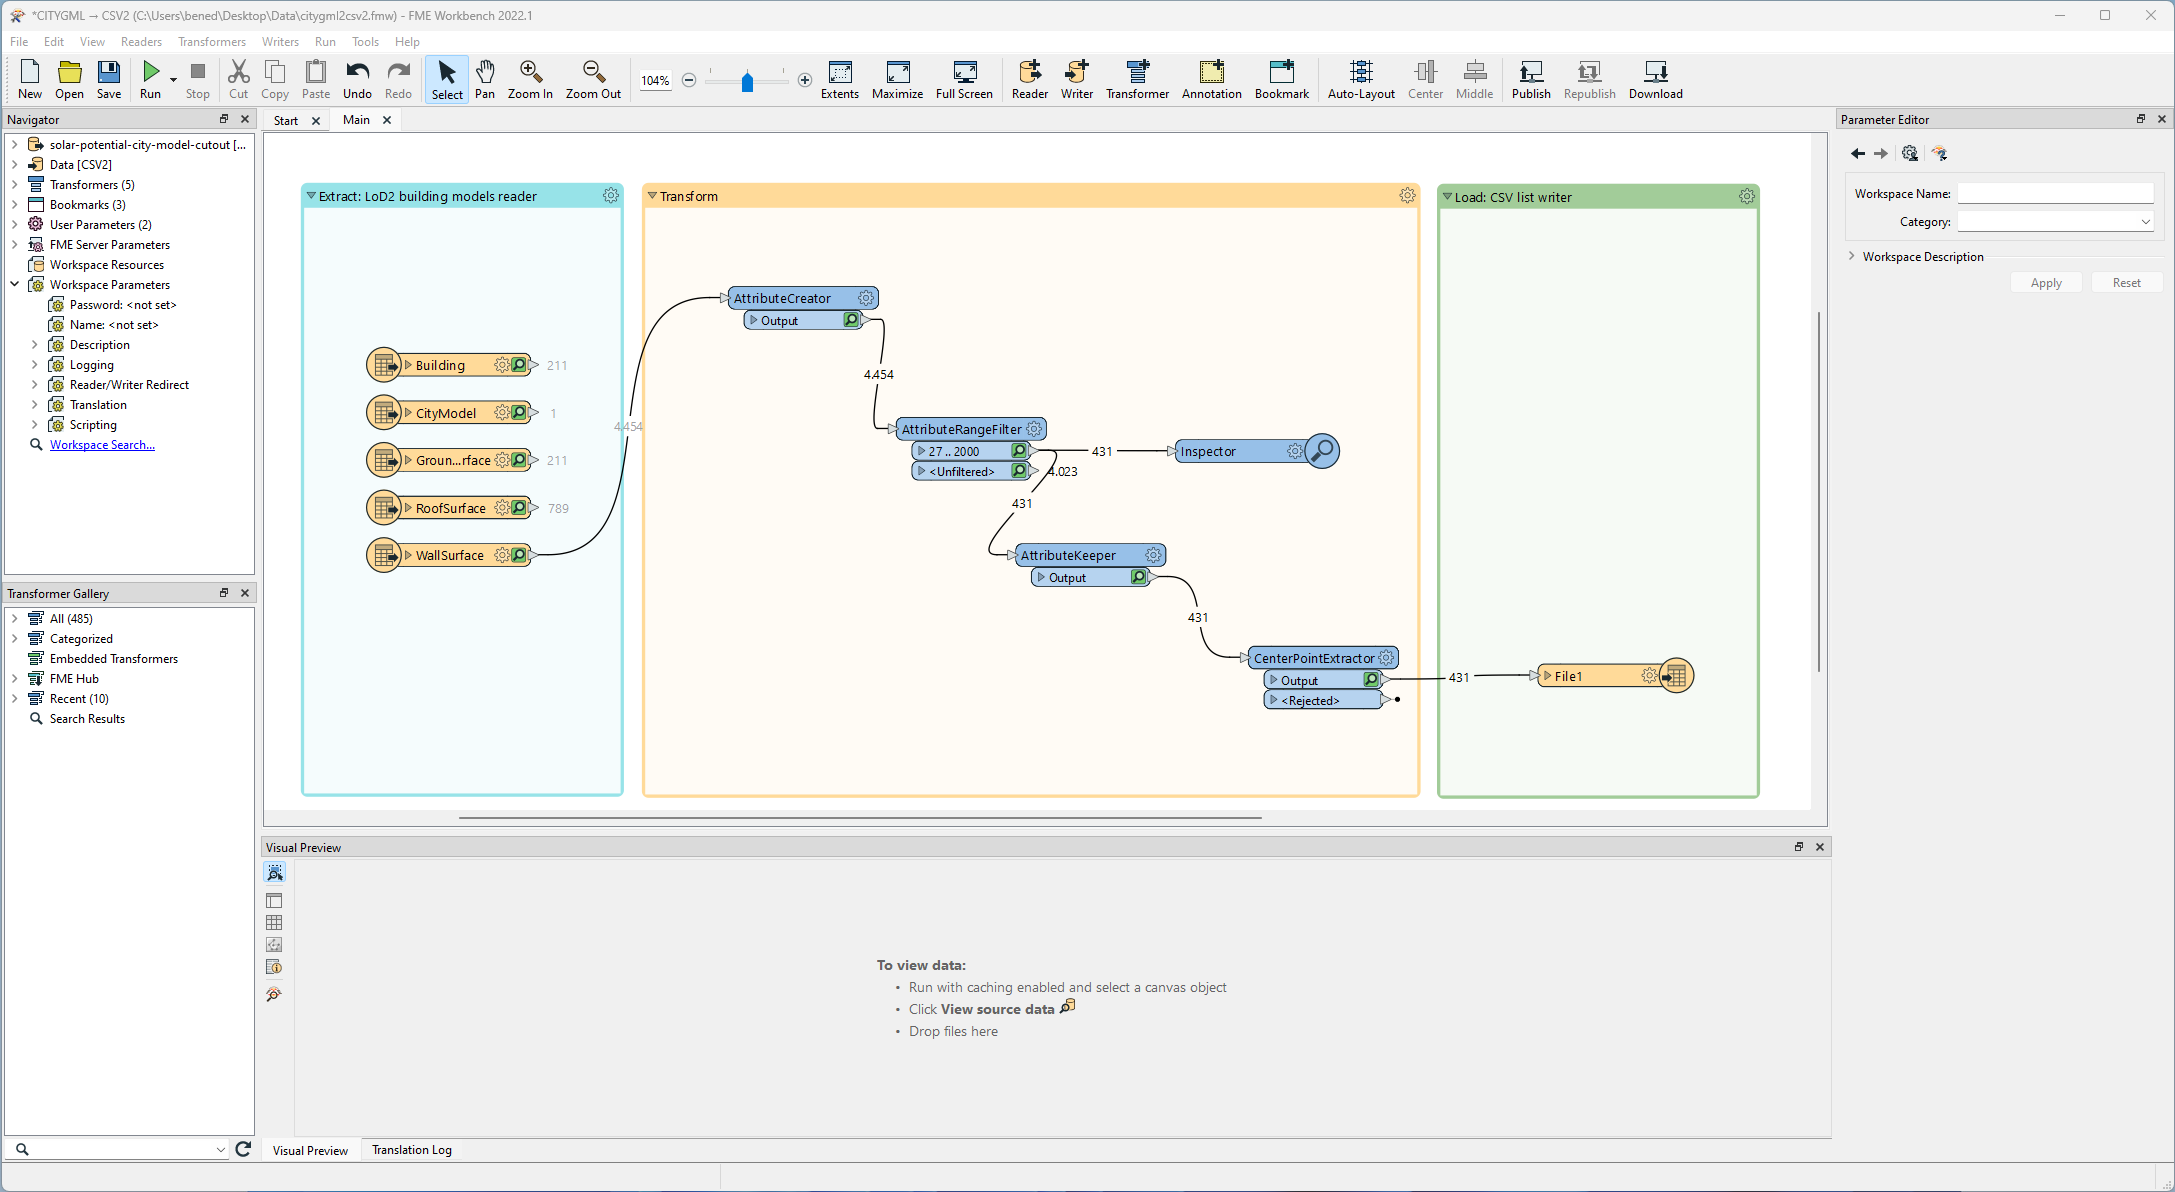
The resulting FME workspace should look similar to the following:
Note
You can and should add bookmarks to organize your workspace.
After running the workspace, you should be able to open the text document with your editor or load it into a spreadsheet software:
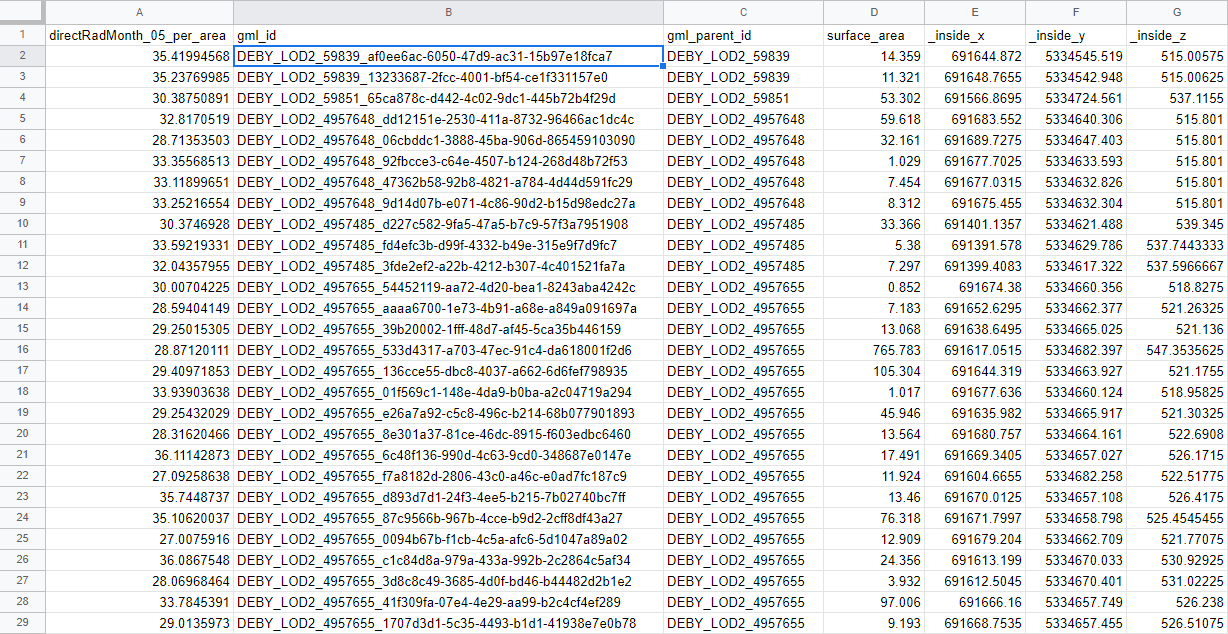
Note
More FME tutorials and training materials can be found in the FME community containing also video material:
3.2 Inspect the Ingolstadt Datasets
For the simulation we will now process and combine different geospatial datasets from multiple sources. The following datasets should be available to you for the city center of Ingolstadt:
orthophotos: aerial photographs from the state agency (source: LDBV)
point-clouds: point clouds from mobile laser scannings (MLS) (source: 3D Mapping Solutions)
city-model: CityGML datasets
road-space-models: road network as well as road space object based on the MLS point clouds (source: 3D Mapping Solutions; converted from OpenDRIVE to CityGML)
Note
You can download the OpenDRIVE datasets as demo data in the customer area of 3D Mapping Solutions. Please note, that FME does not support the reading and writing OpenDRIVE.
lod2-building-models: building models in LoD2 from the state agency (source: LDBV)
lod3-building-models: manually modelled LoD3 building models using the MLS point clouds (source: GitHub)
Open each dataset (except for the HD maps) with the FME Data Inspector and complete the following tasks:
Dataset inspection
Which coordinate reference system (CRS) is used for the dataset?
Tip
The road space models and the LoD3 building models are based on the MLS point cloud and therefore these three datasets have the same CRS.
Take a screenshot of the loaded dataset in the FME Data Inspector.
Tip
Datasets in the same CRS can be easily visualized in the same FME Data Inspector window.
Inspect the characteristics of each dataset in terms of their geometry, semantics, topology and appearance. Create an overview table and give a short summary for each cell in the table:
orthophotos |
point-clouds |
road-space-models |
lod2-building-models |
lod3-building-models |
|
|---|---|---|---|---|---|
Geometry |
e.g.: raster data in 2D |
||||
Semantics |
|||||
Topology |
e.g.: none |
||||
Appearances |
Tip
The terms geometry, semantics, topology and appearances were discussed along with examples in the lecture (especially Introduction & Principles to GIS and Spatio-Semantic Analytics). Thus, the question is whether and, if so, what information the respective datasets contain with respect to these categories.
For topology, one could ask whether a utility network (e.g., electricity or gas) is present in the dataset? If yes, write this in the table (and e.g. provide an example attribute) and if no, inspect further or write none.
You can use bullet points or complete sentences in the cells.
Note
It is sufficient to only inspect a single LoD3 building model.
3.3 Prepare the Geodata for a Graphics Application
In the following you will develop your own FME workspace, which prepares the available geospatial for a target application. Therefore create a new workspace in FME Workbench.
3.3.1 Texturize the Roofs using the Orthophotos
The first goal of this task is to texturize the roof surfaces of the LoD2 building models with the orthophoto, whereas an example result was already shown in the lecture. Generally, there are many different ways to construct a workspace that accomplishes the task. The following tips or steps are therefore only intended as ideas that do not necessarily have to be followed:
orthophotos can be cut out per individual roof surface (conducting this in 2D makes it simpler)
3D geometries of features can be forced into 2D
for setting the appearance of a roof surface feature, the bounding box of the texture is sufficient (in contrast to polygonal texture cutouts)
after setting the appearance, you might need to set the CityGML geometry (but this depends on the subsequent transformers or writers)
it is not necessary to write out the data, the inspector transformer can be helpful here
Some interesting transformers and parameters:
-
Merge Attributes
-
Group Processing:
Group By:
...
Texture Coordinate Generation
Use Existing Texture Coordinates:
YesTexture Mapping Type:
From Top View
-
CityGML LoD name:
LoD2 MultiSurfaceFeature Role:
cityObjectMember
3.3.2 Replace the Trees with Detailed Models
In this step we will read in the road space models and prettify them a bit. To do this, add a CityGML reader for the road space models in the FME workspace.
Note
As we have more detailed building models in the other datasets, we can ignore the building models (with walls, roofs and ground surfaces) from the road space model dataset.
Search for a free 3D tree model on the Internet and download it. With this 3D tree model, we will replace the trees in the road space model dataset which are geometrically represented by cylinders.
Note
To facilitate the replacement logic to be developed in FME, the tree trunk should start at the local coordinate origin and extend vertically upward. Besides FME you can also use Blender, for example, to edit 3D models.
A low poly tree asset to reduce workbench run times and hard asset copies are suggested. The method of geometry instancing is not required for this task like it is applied in this FME community article using the SharedItemAdder and SharedItemIDSetter transformer.
The following tips or steps are only intended as ideas that do not necessarily have to be followed:
filter out the trees, since not all solitary vegetation objects are trees
derive a meaningful point from the cylinder and store it as an attribute of the feature
after merging the features (cylinder and 3D model), you need to translate the feature to this meaningful point
the size of the tree should reasonably suit the rest of the model
Some interesting transformers and parameters:
3.3.3 Combine the Models
In this part, we will combine all the models into one overall model.
Thus, add an additional reader for the LoD3 building models.
The LoD3 building models contain a lot of different geometry types and partly contain geometry errors at the moment.
Please add a GeometryFilter directly after the reader that only allows geometries of type Surface to pass.
Afterwards, insert a GeometryValidator that detects Surfaces and Solid issues, and forward only the passed or repaired geometries.
The provided file city-model/correspondances.csv contains the GML IDs (column ldbv_id) for the LoD2 dataset that have a corresponding LoD3 building model.
Therefore, the roof, wall and ground surface features of the LoD2 dataset having those GML IDs should be filtered out.
Last but not least, the models should be brought into the same coordinate systems: Since LoD3 building models and the road space models are already in the same CRS, it is sufficient to reproject only the LoD2 building models. Furthermore, the datasets use different height coordinate systems. To correct the height offset for our use case, it is sufficient to shift the LoD2 building models upwards by 46.5m.
3.3.4 Export the Models for a Target Application
Now, the models are exported so that we can then import them into a different target application. This can be a 3D graphics application of your choice, such as Blender, a model viewer or, for example, the Unreal Game Engine. Graphics applications usually read formats such as OBJ, COLLADA, FBX and glTF 2.0.
Computer graphics applications expect the models in a different structure regarding their geometry, topology, semantics and appearance. First, applications from the computer graphics domain usually cannot handle large floating-point numbers. Therefore, the overall model should be brought into a local coordinate system. Moreover, the geometries have to be prepared, which is explained in the following Unreal Engine webinar started at 8min 20sec, but is generally applicable for computer graphics applications:
Note
In case you use the Unreal Engine as a target application, the importing and exporting of datasets is facilitated by a collection of plugins and tools called Datasmith. Furthermore, there is a dedicated Unreal Datasmith writer for FME.
3.4 Import into the Graphics Application
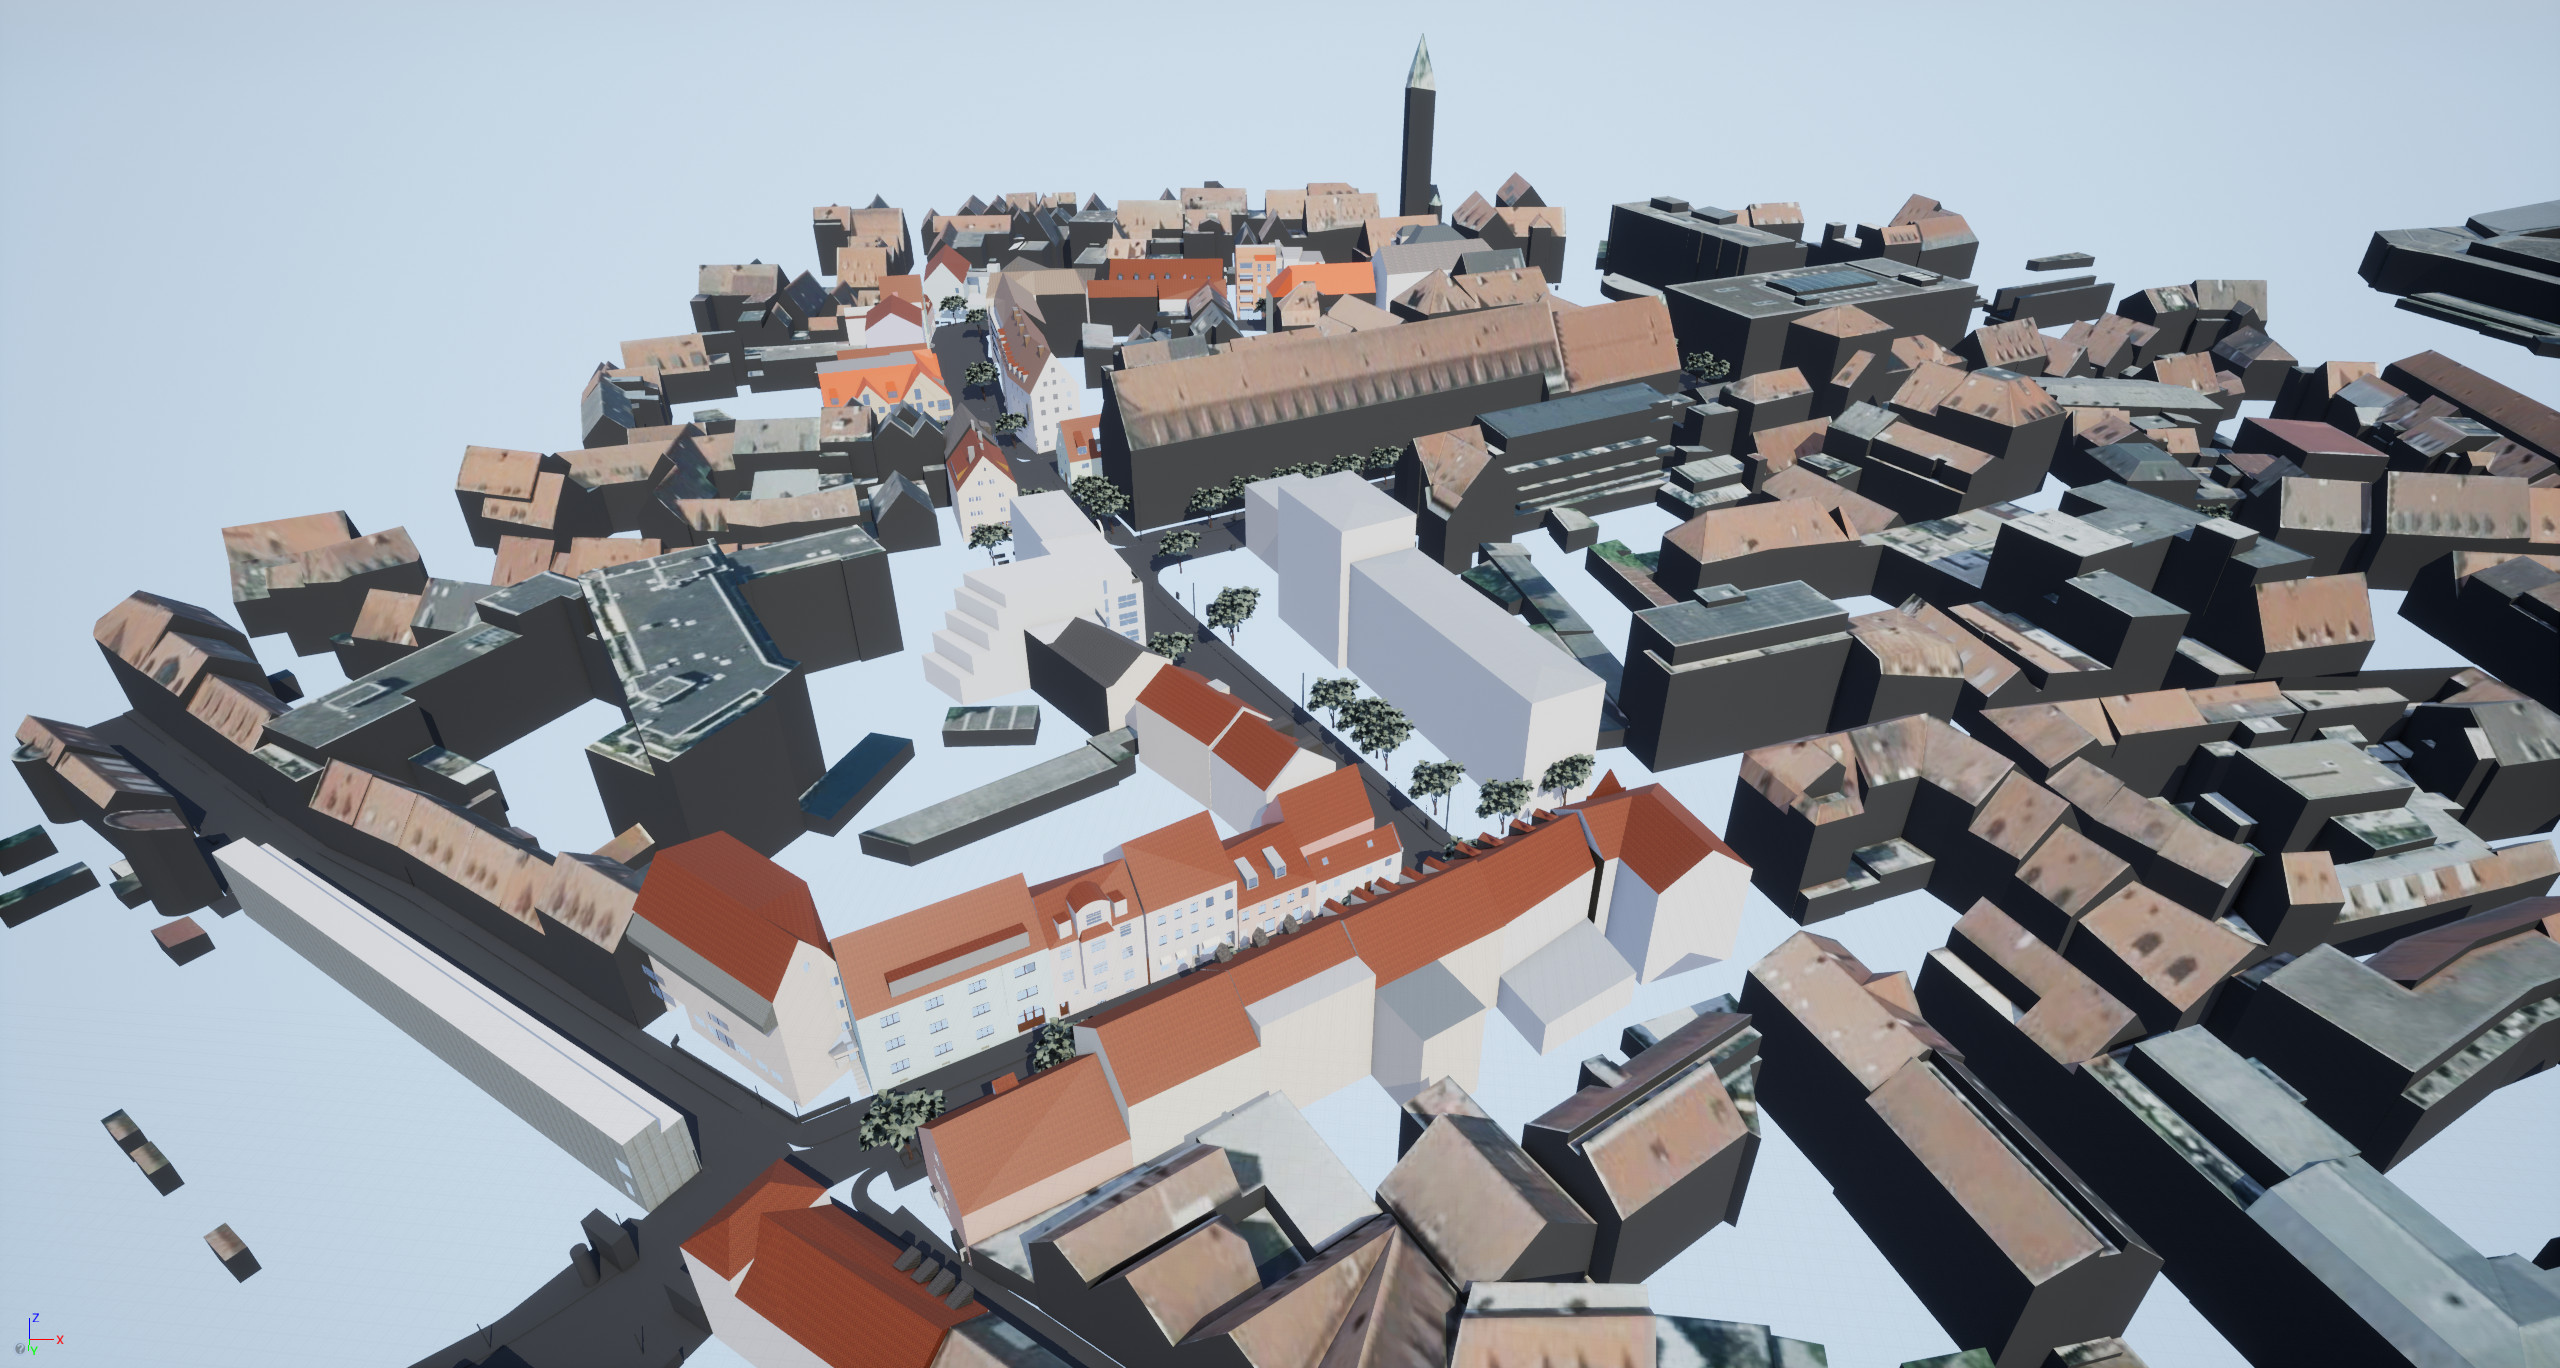
Download and install the graphics application of your choice. Import the models into the application, take 2-3 screenshots or create a short video for the presentation. In case you are using the Unreal Engine and your ETL process was successful, the rendering should look similar like this:
Note
It may take some time for Unreal to compile the shaders. In case of import problems untick some boxes during the import dialogue.
Warning
Computer graphics applications can be very resource-intensive. If you run into technical issues caused by limited hardware resources, use a cropping of the model or contact your tutors.
3.5 Conceptualize Your Project
In the lecture we have now learned about GIS, UML, exchange formats, spatio-semantic analytics, web services, APIs, as well as ETL processes. But more importantly, we put this theory into practice during the mini projects and implemented a broad range of functionalities. The datasets and simulations used in this scope only address individual application examples, while the tools and technologies provide the scaffolding for further solutions in a variety of different domains.
Now let’s think ahead to the future and assume as a thought experiment that we have digital twins of the environment with all the necessary information at our fingertips. Identify a problem that will affect our environment and/or society in the future (but it may also exist today) and where a digital twin could contribute to a solution.
Note
It should be a problem that you care about and that you want to see solved. Think bold and a bit crazy.
Describe the problem in a paragraph and cite two to three academic papers that also discuss this problem.
How could the digital twin with all the necessary information contribute to the solution of the problem? What kind of information or datasets would be needed?
Draw a diagram of the technical architecture for the required digital twin.
Note
This architecture is a brainstorming concept and can therefore be very high level with components such as datasets, database, API, user, simulation and some connecting arrows.
Which organizations or which groups of people could be the users of your solution? How would your users interact with your solution?
3.6 Group Presentation
Your group presentation must include the results of this mini project and discuss the functioning of the developed ETL processes on a suitable abstraction level (a step-by-step explanation of the transformers is too detailed). Furthermore, the questions of each section need to be addressed.
Tip
Please submit your presentation in PDF and PowerPoint format in Moodle using the following naming scheme:
Mini_Project_3_Group_NN.<pdf|pptx>Also submit your well-organized FME Workspace of the section 3.3 Prepare the Geodata for a Graphics Application and 3.4 Import into the Graphics Application in Moodle using the following naming scheme:
Mini_Project_3_Group_NN_FME_Workspace.fmwPlease note the submission date on Moodle.
Your presentation slides must be carefully outlined and formatted. Typos, grammatical errors and layout problems will lead to points deduction.
Please include the first names, last names and matriculation numbers of all team members in the first slide of the presentation.
It is sufficient to submit ONCE per group.
3.7 References
-
FME community article: Creating and Using Geometry Instances
-